Climate Debt: Trinidad and Tobago ranks 3rd (the percentage of GDP is World’s highest)
Sometimes small countries behave extremely destructive, more or less unnoticed by the public. This article is about such a country. Each of the 1.2 million inhabitants of the islands Trinidad and Tobago emitted, on average, 37.1 tons of CO2 from Fossil Fuels (without bunker fuels) and cement production in 2011 … only Qatar emitted more. The islands close to Venezuella has the 3rd largest per capita Climate Debt and by far the world’s largest Climate Debt measured as percentage of GDP(ppp-$).
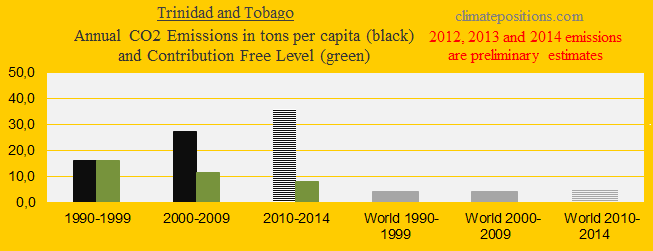
The first diagram (below) shows Trinidad and Tobago’s per capita CO2 Emissions from fossil fuels (without bunker fuels) and cement production in decades in comparison with the world average. CO2 Emissions since 2012 are preliminary estimates. The green bars are the Contribution Free Level, determined by the level of CO2 Emissions in 1990s and a number of continuously updated ‘Indicators’.
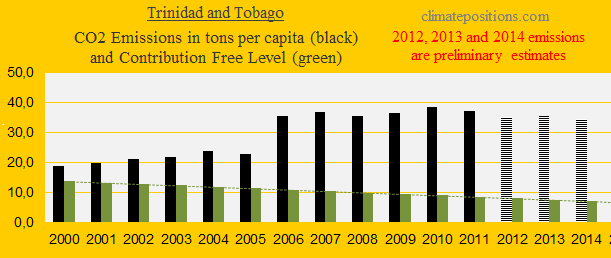
Trinidad and Tobago’s per capita CO2 Emissions from fossil fuels are eight times the global average. The diagram below shows the emissions since 2000. Emissions from 2012, 2013 and 2014 are preliminary estimates. The green bars are the Contribution Free Level. See ‘Emissions on the different sources until 2010’.
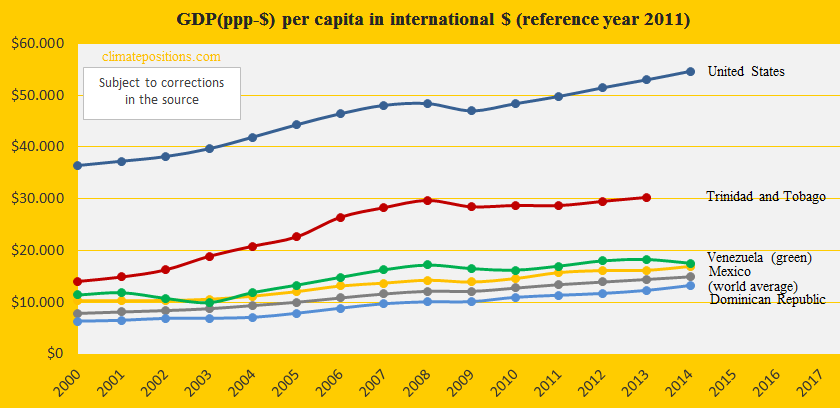
The diagram below shows the development of GDP(ppp-$) since 2000, in comparison with the same group of countries and the world average. The growing wealth of Trinidad and Tobago is paid by future generations.
The current per capita Climate Debt of Trinidad and Tobago’s is $12,826, which is the 3rd largest among 148 countries in ClimatePositions (see the ‘Ranking’ by January 2016).
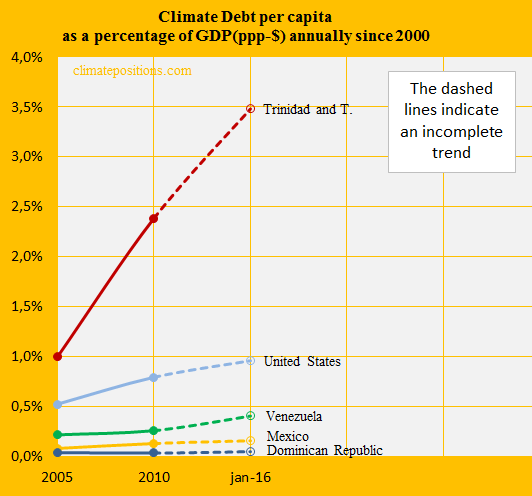
The last diagram shows the Climate Debt as percentage of GDP(ppp-$), annually since 2000, of the same five countries and the world average. January 2016, the annual Climate Debt of Trinidad and Tobago amounted 3.48% of GDP(ppp-$), which makes the islands world leading on climate-destruction-efficiency per dollar earned! (see the ‘Ranking‘). The price per ton CO2 emitted since 2000 is $28.33 (ranked 6th).
.
Data on carbon emissions (CO2 Emissions) from fossil fuels (without bunkers) and cement production are from Global Carbon Project (CDIAC); (links in the menu “Calculations”).
Information on national GDP(ppp-$) per capita: Worldbank (links in the menu “Calculations”).
PowerPoint collage and drawing (Trinidad and Tobago in Oil) by Claus Andersen, 2016.
Comments are closed.