Climate performance: Germany versus Poland
2013
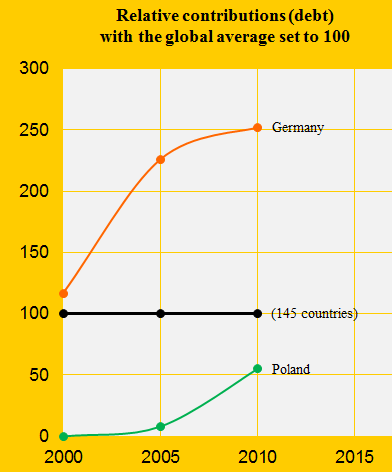
Germany was the 24th worst performing country out of 145 in ClimatePositions 2010 and Poland was the 46th. Five years earlier in 2005 the rankings were respectively 23th and 66th. The diagram shows the performance relatively with the global average set at 100. Germany has performed continuous irresponsible, though slightly less irresponsible in recent years and Poland seems to have given up all the good intentions around 2003. Below we highlight three of the national indicators in the calculations.
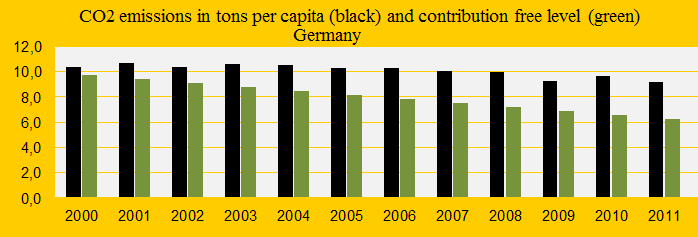
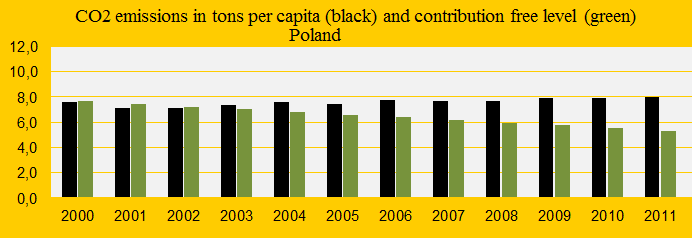
First CO2 emissions (carbon dioxide) per capita for both countries (see the two diagrams below). The German reductions since 2004 lag significantly according to the requirement in ClimatePositions and the rate of annual increase in contributions (climate debt) is therefore growing. Poland was Contribution Free until 2004, but since then the gap between CO2 emissions and free levels (green bars) has run wild. The green bars are calculated from the average national emissions in 1990-1999, adjusted with a variety of updated indicator values (read more in the menu “Calculations/Indicator”).
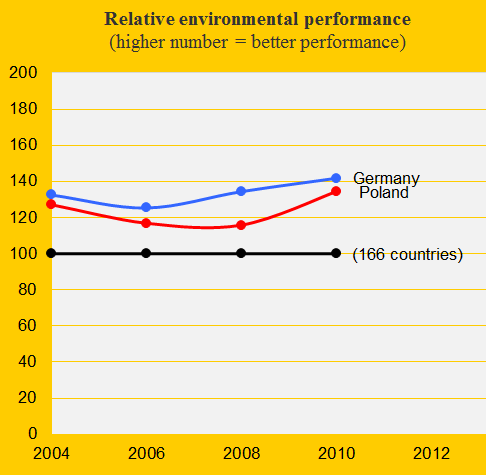
The trend in Environmental Performance is similar for the two countries and relatively better than the global average, set at 100 in the diagram below. Germany holds the lead all year.
Poland has a slightly smaller Ecological Footprint per capita (without CO2 Emissions) than Germany but both countries perform about two times worse than the global average, set at 100 in the diagram below.

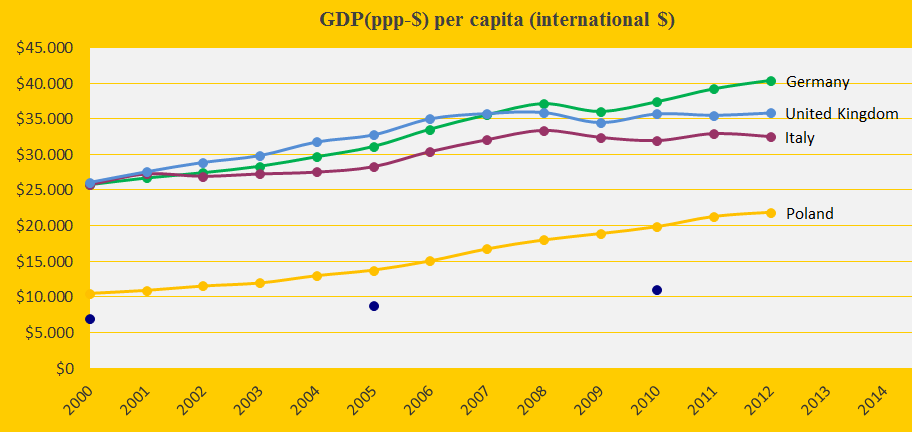
The diagram below shows GDP(ppp-$) for Poland and the three largest total CO2 emitters in the European Union (in 2006-2010): Germany, United Kingdom and Italy. The blue dots show the global average. Poland was the sixth largest total CO2 emitter in the European Union and climate damaging coal is still dominant in the country’s energy supply and economy.
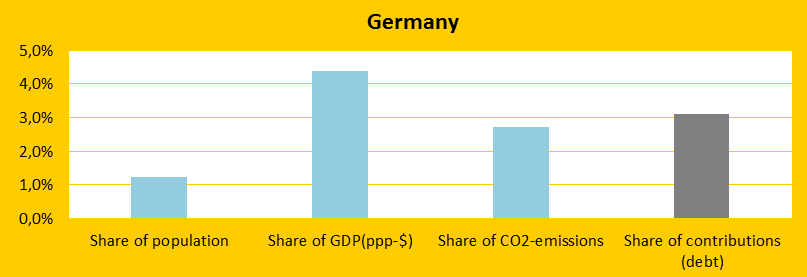
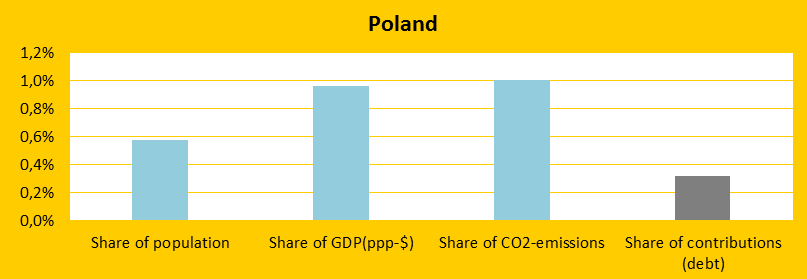
The last two diagrams (below) illustrate the different climate change positions of Germany and Poland. Germany has failed in terms of the necessary rapid CO2 reductions from a very high level and the growing economy appears to have been prioritized. The German share of global contributions (climate debt) is therefore larger than the share of global CO2 emissions. The German share trends is by the way similar to the average in European Union – see ‘here‘. Poland reduced CO2 Emissions satisfactory at the beginning of the century from high levels in the 1990s. Only after 2004, the economy appears to have been prioritized at the expense of CO2 Emissions and Poland’s share of the global contribution is therefor (still) lower than the share of the global population.
A hypothetical example: If Germany’s CO2 Emissions had been identical to the Polish in 1990-2011 (with all other indicators unchanged), then the total German contribution (climate debt) would have been $60 billion in 2011 instead of $104 billion.
Source on CO2 emissions: EIA, U.S. Energy Information Administration (links in the menu “Calculations”).
Information on national GDP(ppp-$) per capita is from Worldbank (links in the menu “Calculations”). Read about GDP+ in the submenu ”Indicators”.
Data on national and global populations are from the EIA, U.S. Energy Information Administration. Global population before 1980 is from United Nations (UN) (links in the menu “Calculations”).
Data sources on ecological footprint: WWF reports “The Living Planet” published 2006-2012 (links in the menu “Calculations”).
Data sources on environmental performance are from Yale and Columbia University reports, published 2006-2012 (links in the menu “Calculations”).
Comments are closed.