Climate performance of Israel, Occupied Palestinian Territories and neighboring countries

2014
Israel was the 16th worst performing country out of 145 in ClimatePositions 2010 with a Climate Contribution of $1,790 per capita (see the ranking in the menu “Calculation”). The Palestinian Territories (Gaza Strip and West Bank, both occupied by Israel) were in reality Contribution Free (though excluded from the inventory due to lack of indicator data¹). The following examines the statistics of Israel, the Occupied Palestinian Territories, Lebanon, Jordan, Syria and Egypt.
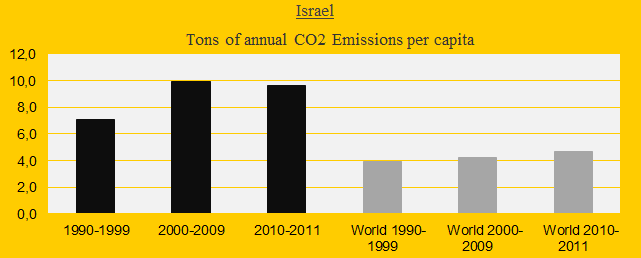
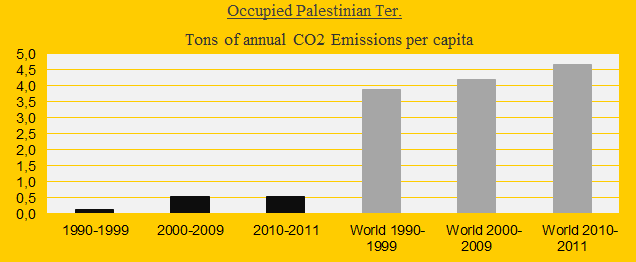
The two diagrams below show the CO2 Emissions per capita in decades of Israel and the Occupied Palestinian Territories in comparison with the world average. In 2011 Israel’s CO2 Emissions were 9.6 tons and the Occupied Palestinian Territories’ were 0.6 tons. One Israeli emits the same as sixteen Palestinians. The CO2 Emissions of the neighboring countries were: Lebanon 4.7 tons, Jordan 2.9 tons, Syria 2.8 tons and Egypt 2.5 tons.
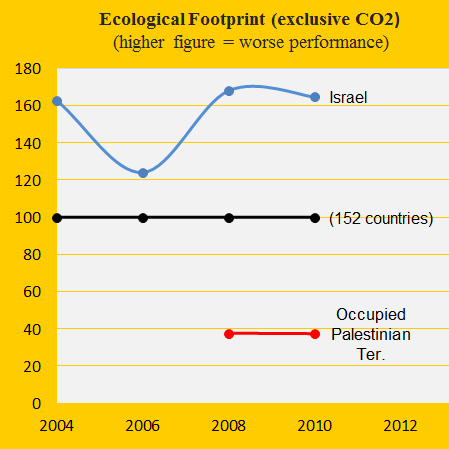
The Ecological Footprint per capita (without CO2 Emissions) is more than four times larger in Israel than in the Occupied Palestinian Territories (see below). The footprints of Lebanon, Jordan, Syria and Egypt lie between the two.
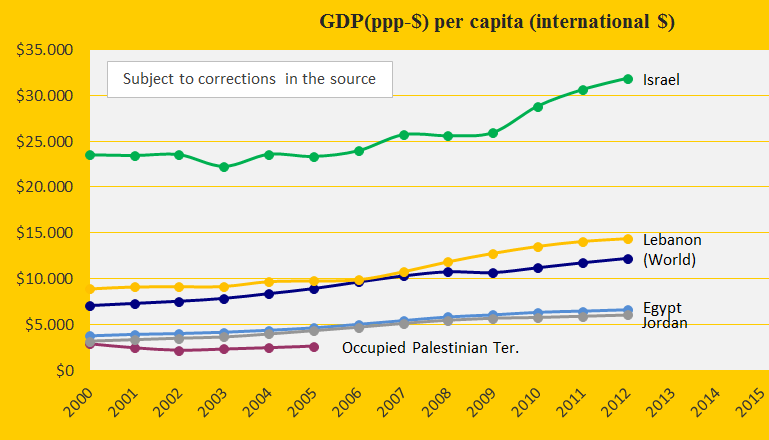
The diagram below shows the GDP(ppp-$) per capita of Israel, Lebanon, Egypt, Jordan, the Occupied Palestinian Territories and the world average. Indicator data are lacking since 2005 for the Palestinian Territories. On the Israel Defense Forces’ website you can read this perverted depiction: “The Gaza Strip economy continues to improve: In the summer of 2011, a new 10-story, five-star hotel with luxurious banquet halls made of marble and stone, first-class restaurants and a shining swimming pool was opened.”
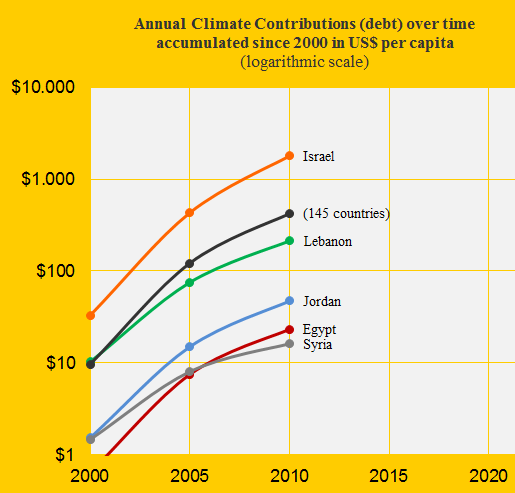
The last diagram shows the Climate Contribution (climate debt) per capita since 2000 of Israel, Lebanon, Jordan, Egypt, Syria and the world average. As mentioned, the Occupied Palestinian Territories are in reality Contribution Free.
¹ The missing indicator data of the Occupied Palestinian Territories are: GDP(ppp-$) since 2005 and Environmental Performance.
Source on CO2 Emissions: EIA, U.S. Energy Information Administration (links in the menu “Calculations”).
Source on Ecological Footprint: WWF reports “The Living Planet” published 2006-2012 (links in the menu “Calculations”).
Information on national GDP(ppp-$) per capita: Worldbank (links in the menu “Calculations”).
Drawing by Claus Andersen, 2014 (Quote from Amnesty International’s website about Israel’s brutal force against Palestinians: “Several victims were shot in the back suggesting that they were targeted as they tried to flee and posed no genuine threat to the lives of members of Israeli forces or others.”).
Comments are closed.