Climate performance: South Africa versus Botswana
2014
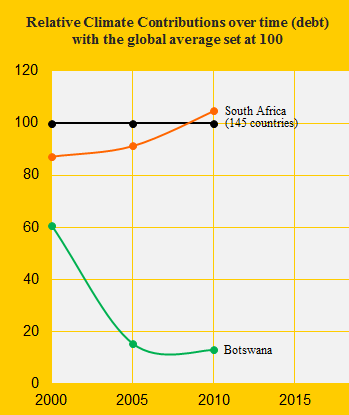
South Africa was the 38th worst performing country out of 145 in ClimatePositions 2010 while the neighboring Botswana was the 60th. The Climate Contributions (climate debt) were respectively $448 and $69 per capita (with the latest updates the amounts have increased to $592 and $84 per capita). See the relative Contributions in 2000, 2005 and 2010 in the diagram with the global average set at 100. Below we highlight some of the national indicators in the calculations.
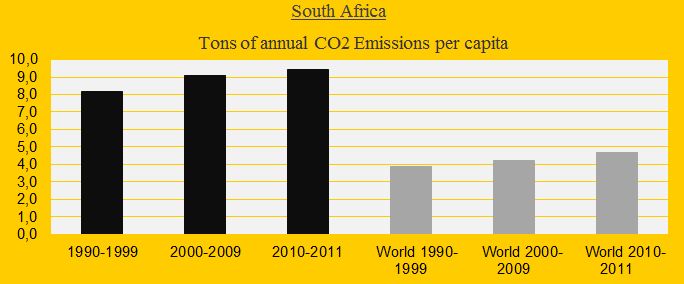
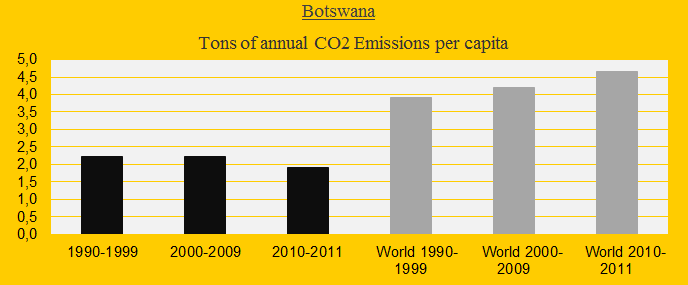
The diagrams below show the two country’s CO2 Emissions (carbon dioxide) per decade compared to the global average. South Africa is performing very poorly while Botswana is doing acceptable. Had South Africa reduced CO2 Emissions from 8.6 tons in 2000 to 5.6 tons in 2011 the Climate Contribution would have been $206 per capita today instead of $592.
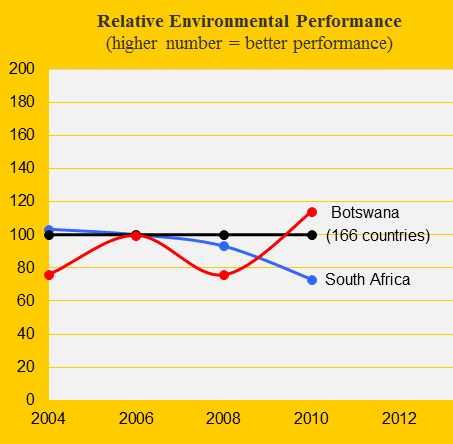
Both countries cross the world average (set at 100 in the diagram below) in Environmental Performance in the six-year period, with Botswana as the winner in 2010. South Africa climbs steadily downward.
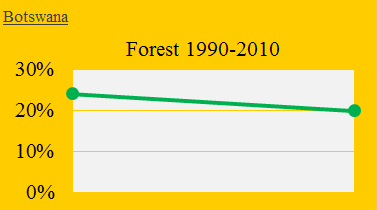
Botswana has reduced the total forest cover from 24.2% in 1990 to 20.0% in 2010 (see the diagram below), while South Africa has retained its 7.6% forest over the same period. In ClimatePositions deforestation before 1990 doesn’t cost – deforestation after 1990 does.
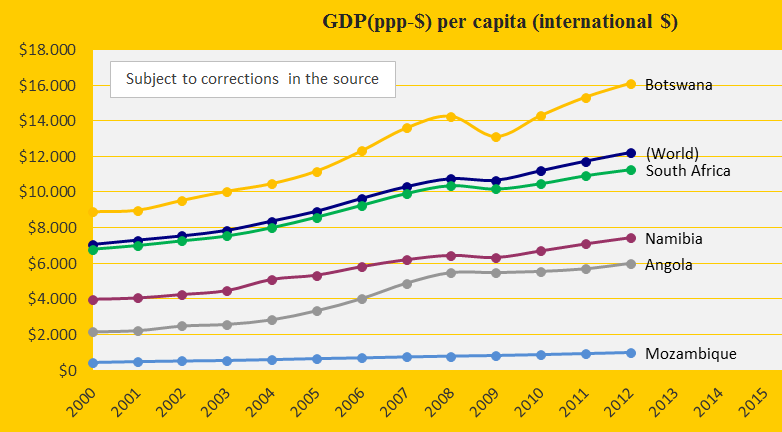
The diagram below shows the development in GDP(ppp-$) for Botswana, South Africa, Namibia, Angola, Mozambique and the world average (the blue dots). The global financial crisis occurred in 2008. Botswana’s growing economy is due to mining of diamonds, metals and minerals – a country with only 2 million inhabitants that has had the world’s fastest growing standard of living since becaming independent in 1966. Income inequality in Botswana and South Africa is huge with rankings of 9th and 15th respectively, among 128 countries (with 128 as the most equal).
A hypothetical example: Had Botswana since 2004 performed as the global average in terms of Environmental Performance and Ecological Footprint – and in addition increased the forest cover since 1990 by 2% instead of reducing it by 4.2% – the country would have been Contribution Free today.
Information on national GDP(ppp-$) per capita: Worldbank (links in the menu “Calculations”).
Source on CO2 emissions: EIA, U.S. Energy Information Administration (links in the menu “Calculations”).
Source on environmental performance: Yale and Columbia University reports, published 2006-2012 (links in the menu “Calculations”).
Sources on national forest area: United Nations (UN) (links in the menu “Calculations”).
Comments are closed.