CO2 Emissions from flights
2014
Since the early 1990s the passenger-kilometers of flights worldwide has increased by 5-6% per year. The CO2 Emissions (carbon dioxide) per passenger kilometer vary due to difference in flight distances¹, aircrafts and load factors (percent of occupied seats) – with average load factors First Class and Business Class are causing nine- and three-times higher emissions per passenger than Economy Class, as one study suggests². Furthermore the mixed exhaust from flights causes 2-4 times more global warming than only CO2 emitted from engines on the ground³. The accumulated climate-effect from flights might be as high as 7-9% of the total effect from anthropogenic greenhouse gases4. However, the following examines only the CO2 Emissions from flights and the implied national costs in Climate Contributions (climate debt). But first see these three seductive animations (from ‘nats‘) with 24-hours flights over ‘Europe 1:59‘, ‘Middle East 1:11‘ and ‘North Atlantic 1:52‘.
The calculations in the following sections are based on data from the website ‘Flight emissions calculator’ (travelnav.com). Here you can easily enter airports, cities, states, countries, or zip codes to compute the CO2 Emissions between any two locations. Long distance flights and domestic flights from nine countries are included in the survey below. The countries are: South Korea, Australia, South Africa, United Kingdom, United States, Brazil, Saudi Arabia, China and India.
South Korea was the 15th worst performing country in the ‘2010-ranking’ (overall Climate Contributions) and in 2011 the CO2 Emissions were 12.5 tons per capita. A flight from Seoul to Sydney, Australia (roundtrip) emits 1.8 tons of CO2 per passenger equivalent to 42% of the Contribution Free Level of 4.2 tons per capita in 2011. The savings in Climate Contribution by canceling the flight would be $73 per passenger. Seventeen domestic flights from Seoul to Busan (roundtrip) would have the same effect.
Australia was the 6th worst performing country in the 2010-ranking and in 2011 the CO2 Emissions were 18.0 tons per capita. A flight from Sydney to Cape Town, South Africa (roundtrip) emits 2.3 tons of CO2 per passenger equivalent to 27.4% of the Contribution Free Level of 8.5 tons per capita in 2011. The savings in Climate Contribution by canceling the flight would be $140 per passenger. Nine domestic flights from Sydney to Adelaide (roundtrip) would have the same effect.
South Africa was the 38th worst performing country in the 2010-ranking and in 2011 the CO2 Emissions were 9.4 tons per capita. A flight from Cape Town to London, United Kingdom (roundtrip) emits 2.0 tons of CO2 per passenger equivalent to 41.5% of the Contribution Free Level of 4.9 tons per capita in 2011. The savings in Climate Contribution by canceling the flight would be $32 per passenger. Five domestic flights from Cape Town to Pretoria (roundtrip) would have the same effect.
United Kingdom was the 26th worst performing country in the 2010-ranking and in 2011 the CO2 Emissions were 7.9 tons per capita. A flight from London to New York, NY (roundtrip) emits 1.2 tons of CO2 per passenger equivalent to 19.8% of the Contribution Free Level of 6.0 tons per capita in 2011. The savings in Climate Contribution by canceling the flight would be $66 per passenger. Ten domestic flights from London to Sunderland (roundtrip) would have the same effect.
United States was the 7th worst performing country in the 2010-ranking and in 2011 the CO2 Emissions were 17.6 tons per capita. A flight from New York to Rio de Janeiro, Brazil (roundtrip) emits 1.6 tons of CO2 per passenger equivalent to 16.0% of the Contribution Free Level of 10.2 tons per capita in 2011. The savings in Climate Contribution by canceling the flight would be $122 per passenger. Three domestic flights from New York to Miami (roundtrip) would have the same effect.
Brazil was the 61st worst performing country in the 2010-ranking and in 2011 the CO2 Emissions were 2.4 tons per capita. A flight from Rio de Janeiro to Riyadh, Saudi Arabia (roundtrip) emits 2.3 tons of CO2 per passenger equivalent to 133.5% of the Contribution Free Level of 1.8 tons per capita in 2011. The savings in Climate Contribution by canceling the flight would be $37 per passenger. Five domestic flights from Rio de Janeiro to Rio Grande (roundtrip) would have the same effect.
Saudi Arabia was the 12th worst performing country in the 2010-ranking and in 2011 the CO2 Emissions were 19.7 tons per capita. A flight from Riyadh to Beijing, China (roundtrip) emits 1.4 tons of CO2 per passenger equivalent to 19.2% of the Contribution Free Level of 7.3 tons per capita in 2011. The savings in Climate Contribution by canceling the flight would be $56 per passenger. Six domestic flights from Riyadh to Jeddah (roundtrip) would have the same effect.
China was the 57th worst performing country in the 2010-ranking and in 2011 the CO2 Emissions were 6.5 tons per capita. A flight from Beijing to New Delhi, India (roundtrip) emits 0.8 tons of CO2 per passenger equivalent to 33.6% of the Contribution Free Level of 2.4 tons per capita in 2011. The savings in Climate Contribution by canceling the flight would be $8 per passenger. Four domestic flights from Beijing to Shenyang (roundtrip) would have the same effect.
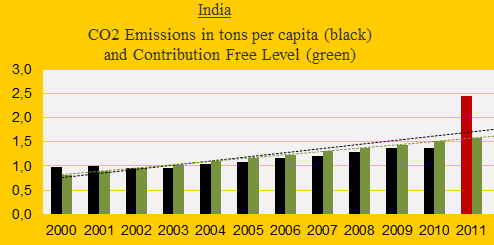
India was Contribution Free in the 2010-ranking and in 2011 the CO2 Emissions were 1.5 tons per capita. A flight from New Delhi to Seoul, South Korea (roundtrip) emits 1.0 tons of CO2 per passenger equivalent to 63% of the Contribution Free Level of 1.6 tons per capita in 2011. This example is illustrated in the diagram below (the red bar). The cost in Climate Contribution of the flight would be $2 per passenger ($5 per passenger after having passed the Contribution Free Level of CO2). Three domestic flights from New Delhi to Mumbai (roundtrip) would have the same effect. India has the fastest growing airline fleet in the world.
Taken into account that the climate impact of flights is 2-4 times worse than the actual CO2 Emissions, the overall conclusion must be that flights should be an exception in a sustainable future.
A hypothetical example: If the first eight countries in the survey paid their climate debt of $1,744 billion accumulated between 2000 and 2010 to a fictive Global Climate Fund, India could apply for co-financing for sustainable transport solutions instead of expanded air traffic.
.
¹ Short distance flights generally emit 2-3 times more CO2 per kilometer than long distance flights (distances less than 463 km: 257 g CO2 per km and long distance flights: 113 g CO2 per km). See ‘Wikipedia’.
² ‘Study’ published by World Bank, 2013 (of the effect on CO2 emissions of its staff’s travel). See ‘Wikipedia’.
³ Estimatet by the Intergovernmental Panel on Climate Change (IPCC). See ‘Wikipedia’.
4 ‘Report’ from Environmental Change Institute, Oxford University, 2007. See ‘Wikipedia’. The IPCC has estimated that aviation is responsible for around 3.5% of anthropogenic climate change (includes both CO2 and non-CO2 induced effects).
Source on CO2 Emissions: EIA, U.S. Energy Information Administration (links in the menu “Calculations”).
Drawing by Claus Andersen, 2014.
Comments are closed.