Environmental Performance Index 2014: Rankings of 178 countries

2014
Every second year Yale and Colombia Universities, in collaboration with the World Economic Forum, publish an Environmental Performance Index (EPI) with global rankings. The 2014 edition with rankings of 178 countries is now available ‘here’. The top ten countries are shown in the diagram. The Index ranks how well the countries perform on 1) Health Impacts (Air Quality, Water and Sanitation) and 2) Ecosystem Vitality (Water Resources, Agriculture, Forests, Fisheries, Biodiversity and Habitat, Climate and Energy). Underlying the nine issue categories are 20 indicators calculated from country-level data and statistics. Scores are converted to a scale of 0 to 100, with 0 being the worst observed value and 100 the best.
Note that the global data is lacking on a number of key environmental issues: freshwater quality, toxic chemical exposures, municipal solid waste management, nuclear safety, wetlands loss, agricultural soil quality and degradation, recycling rates, adaptation, vulnerability and resiliency to climate change and desertification.
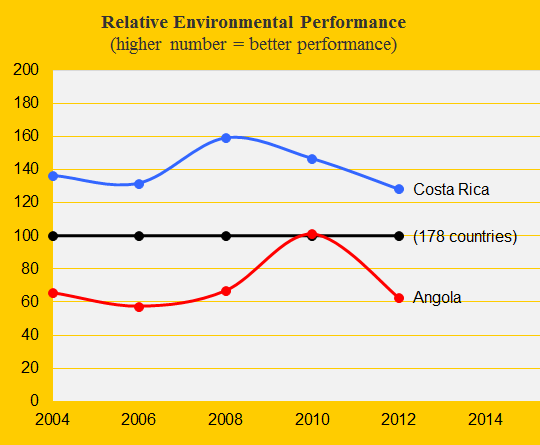
The average national scores in the Environmental Performance Index (since 2006) are being used as an indicator in ClimatePositions (the data year is set at two years prior to the release year). Updated Environmental Performance scores of the 178 countries are now available with illustrative diagrams in the menu “Calculation (Excel)”. See an example with the development of the best performing Contribution Free country Costa Rica and the poorly performing country Angola in the diagram below, with the global average set at 100. Had Costa Rica performed as poorly as Angola since 2004, then the Climate Contribution (climate debt) would have been $71 million or $16 per capita, instead of Contribution Free.
A top ranking in the Environmental Performance Index is not a guarantee of sustainability as the following comparative statistics show (with different statistical year span):
- The 25 best environmental-performing countries have large average Ecological Footprints of 2.49 (in average without CO2 Emissions) and large average CO2 Emissions of 8.6 tons per capita annually.
- The 25 worst environmental-performing countries have small average Ecological Footprints of 0.95 (in average without CO2 Emissions) and low average CO2 Emissions of 1.8 tons per capita annually.
The Environmental Performance Index includes many important indicators but pay little attention to climate change (the national CO2 Emissions) and the consumption of the planet’s limited resources.
Source on Environmental Performance Index: Yale and Columbia University reports, published 2006-2014 (links in the menu “Calculations”).
Comments are closed.