Fossil fuel subsidies: $5.3 trillion in 2015 (IMF survey)
2015
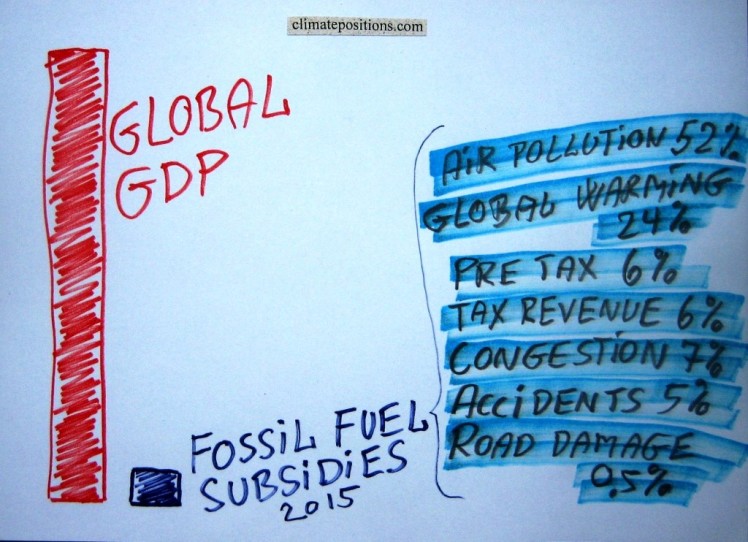
Estimates from the ‘International Monetary Fund’ (IMF) show that fossil fuel subsidies of 155 countries representing 98% of the world’s population, amounted $4.2 trillion (5.8% of global GDP) in 2011 and $4.9 trillion (6.5% of global GDP) in 2013. Projections for 2015 suggest $5.3 trillion (6.5% of global GDP). This huge amount of subsidies is of cause plain stupid.
For comparison, the total ‘Climate Debt of 147 countries‘ in ClimatePositions, accumulated between 2000 and 2013, amounted $5.2 trillion. Roughly speaking, one year of global subsidies equals the total accumulated Climate Debt. Note that global climate change funding is only around $0.14 trillion.
The survey separates national subsidies into seven components¹. The largest community costs left unpaid by the fossil fuel polluters are from local air pollution, and floods, droughts and storms caused by climate change. The largest community costs left unpaid by the fossil fuel polluters are from floods, droughts and storms caused by climate change, and from local air pollution. According to IMF, 52% of the fossil fuel subsidies are aimed at coal and 33% at petroleum. Read the article ‘G20 countries pay over $1,000 per citizen in fossil fuel subsidies, says IMF’ from the Guardian. The following analyzes fossil fuel subsidies and Climate Debts as percentages of GDP, of 131 countries included both in the IMF survey and ClimatePositions.
The table below divides the 155 countries from the IMF survey into two equally populated country groups: 1) 81 countries with Climate Debts larger than $69 per capita in 2013 (see the ‘ranking’), and 2) 74 rest countries of which the large majority have no Climate Debt. As it shows, the Climate Debt-group is responsible for the overwhelmingly large proportions of both fossil fuel subsidies, CO2 Emissions from fossil fuels and the accumulated Climate Debt since 2000.
| 2013 | Population | Fossil Fuel | CO2 | Climate |
| . | (155 countries) | Subsidies | Emissions | Debt |
| . | . | . | . | . |
| Climate Debt over $69 per capita | 50% | 85% | 88% | 99% |
| Rest countries (74 out of 155) | 50% | 15% | 12% | 1% |
The next table shows the fossil fuel subsidies and Climate Debts as percentages of GDP of 131 countries. The table is ranked by 2013-subsidies (largest percentage at the top). The numbers in brackets ranks the world’s twenty largest per capita fossil fuel producers (only Brunei (3) and Equatorial Guinea (9) are not included the list below). Increasing percentages in the second time-period are in red and decreasing percentages are in blue.
In general, there seems to be no convincing correlation between reductions of subsidies and slowdown of the accumulating Climate Debt, or conversely. Only Jordan, Botswana and Honduras have reduced both subsidies and Climate Debt (as percentages of GDP), while 12 countries have increased both. 11 out of the 18 largest per capita fossil fuel producers have reduced subsidies, while 2 have increased. According to IMF calculations the ending of fossil fuel subsidies would reduce global CO2 Emissions by more than 20%. More about the five largest CO2 emitters below the table.
| . | (131 countries) | Subsidies | Subsidies | Climate Debt | Climate Debt |
| . | . | Share of GDP | Share of GDP | Share of GDP | Share of GDP |
| . | . | 2013 | 2015 | 2000-2010 | 2000-2014 |
| . | . | . | . | (annually) | (annually) |
| . | . | . | . | . | . |
| 1. | Ukraine | 51% | 61% | 0.11% | 0.17% |
| 2. | Bosnia and Her. | 38% | 37% | 0.31% | 0.42% |
| 3. | Kyrgyzstan | 35% | 26% | free | free |
| 4. | Bulgaria | 34% | 34% | 0.20% | 0.32% |
| 5. | Uzbekistan | 34% | 26% | 0.14% | 0.17% |
| 6. | Serbia | 34% | 35% | 0.35% | 0.37% |
| 7. | Iran | 32% | 26% | 0.43% | 0.55% |
| 8. | Turkmenistan (11) | 29% | 23% | 0.94% | 1.25% |
| 9. | Venezuela (19) | 26% | 20% | 0.28% | 0.33% |
| 10. | Zimbabwe | 24% | 23% | free | free |
| 11. | China | 19% | 20% | 0.32% | 0.43% |
| 12. | Macedonia | 18% | 19% | free | 0,01% |
| 13. | Libya | 18% | 10% | 0.45% | 0.47% |
| 14. | Saudi Arabia (8) | 17% | 13% | 1.02% | 1.46% |
| 15. | Egypt | 17% | 10% | 0.05% | 0.06% |
| 16. | Russia (16) | 15% | 16% | 0.43% | 0.65% |
| 17. | Mongolia | 15% | 21% | free | free |
| 18. | India | 14% | 12% | free | free |
| 19. | Trinidad and T. (5) | 14% | 13% | 3.24% | 4.05% |
| 20. | Algeria | 14% | 10% | 0.01% | 0.06% |
| 21. | Bahrain (14) | 14% | 11% | 1.30% | 1,53% |
| 22. | Oman (7) | 12% | 9% | 0,99% | 1.42% |
| 23. | South Africa | 12% | 13% | 0.49% | 0,61% |
| 24. | Kuwait (2) | 12% | 8% | 2,10% | 2.70% |
| 25. | Lebanon | 11% | 10% | 0.20% | 0,24% |
| 26. | Indonesia | 11% | 8% | 0,07% | 0.07% |
| 27. | Bolivia | 11% | 7% | 0.02% | 0.03% |
| 28. | Jordan | 11% | 4% | 0.10% | 0.09% |
| 29. | Belarus | 10% | 7% | 0.05% | 0.16% |
| 30. | Kazakhstan (15) | 10% | 11% | 0.35% | 0.61% |
| 31. | Malaysia | 9% | 6% | 0.40% | 0.49% |
| 32. | Azerbaijan (18) | 9% | 6% | free | free |
| 33. | Ecuador | 9% | 6% | 0,07% | 0,07% |
| 34. | Poland | 9% | 9% | 0,13% | 0,22% |
| 35. | Pakistan | 9% | 0% | free | free |
| 36. | Arab Emirates (6) | 9% | 7% | 1.18% | 1.66% |
| 37. | Zambia | 8% | 8% | free | free |
| 38. | Qatar (1) | 8% | 6% | 1.52% | 2.18% |
| 39. | Czech Republic | 8% | 8% | 0.25% | 0.34% |
| 40. | Romania | 7% | 7% | free | 0,01% |
| 41. | Mozambique | 7% | 7% | free | free |
| 42. | Yemen | 7% | 1% | free | free |
| 43. | Bangladesh | 7% | 4% | free | free |
| 44. | Tajikistan | 6% | 7% | free | free |
| 45. | Angola | 6% | 3% | 0.04% | 0.05% |
| 46. | Thailand | 6% | 7% | 0.21% | 0.27% |
| 47. | Congo (Brazz.) | 6% | 6% | free | free |
| 48. | Dominican Rep. | 6% | 6% | 0.05% | 0.06% |
| 49. | Tunisia | 6% | 4% | 0.02% | 0.02% |
| 50. | Haiti | 6% | 4% | free | free |
| 51. | Botswana | 5% | 4% | 0.06% | 0.04% |
| 52. | El Salvador | 5% | 5% | free | free |
| 53. | Armenia | 5% | 4% | 0.18% | 0.22% |
| 54. | South Korea | 5% | 5% | 0.77% | 1.16% |
| 55. | Georgia | 5% | 5% | free | free |
| 56. | Nicaragua | 5% | 4% | free | free |
| 57. | Sri Lanka | 5% | 3% | free | free |
| 58. | Mexico | 5% | 2% | 0.14% | 0.16% |
| 59. | Moldova | 5% | 6% | free | free |
| 60. | Morocco | 4% | 2% | free | free |
| 61. | Lithuania | 4% | 4% | free | free |
| 62. | Tanzania | 4% | 4% | free | free |
| 63. | Honduras | 4% | 1% | 0.06% | 0.03% |
| 64. | Côte d’Ivoire | 4% | 4% | free | free |
| 65. | Namibia | 4% | 4% | 0.03% | 0.02% |
| 66. | Turkey | 4% | 5% | 0.12% | 0.17% |
| 67. | Senegal | 4% | 2% | free | free |
| 68. | Malawi | 4% | 3% | free | free |
| 69. | United States (20) | 4% | 4% | 0.84% | 0.98% |
| 70. | Jamaica | 4% | 2% | 0.14% | 0.16% |
| 71. | Ethiopia | 4% | 3% | free | free |
| 72. | Hungary | 3% | 4% | 0.12% | 0.15% |
| 73. | Panama | 3% | 3% | 0.16% | 0.18% |
| 74. | Benin | 3% | 0% | free | free |
| 75. | Croatia | 3% | 4% | 0.19% | 0.21% |
| 76. | Albania | 3% | 2% | free | free |
| 77. | Cameroon | 3% | 3% | free | free |
| 78. | Vietnam | 3% | 3% | free | free |
| 79. | Paraguay | 3% | 2% | free | free |
| 80. | Guatemala | 3% | 2% | free | free |
| 81. | Brazil | 3% | 2% | 0.07% | 0.09% |
| 82. | Slovakia | 3% | 3% | 0.18% | 0.23% |
| 83. | Chile | 3% | 3% | 0.20% | 0.26% |
| 84. | Japan | 3% | 3% | 0.42% | 0.46% |
| 85. | Cambodia | 3% | 3% | free | free |
| 86. | Israel | 3% | 3% | 0.65% | 0.79% |
| 87. | Colombia | 3% | 3% | free | free |
| 88. | Sudan | 2% | 2% | free | free |
| 89. | Greece | 2% | 3% | 0.45% | 0.49% |
| 90. | Singapore | 2% | 2% | 2.11% | 2.92% |
| 91. | Nepal | 2% | 2% | free | free |
| 92. | Slovenia | 2% | 2% | 0.39% | 0.47% |
| 93. | Dem. Rep. Congo | 2% | 2% | free | free |
| 94. | Philippines | 2% | 3% | free | free |
| 95. | Canada (12) | 2% | 2% | 0.87% | 1.00% |
| 96. | Belgium | 2% | 2% | 0.73% | 0.90% |
| 97. | Kenya | 2% | 2% | free | free |
| 98. | Nigeria | 2% | 1% | free | free |
| 99. | Uganda | 2% | 2% | free | free |
| 100. | Australia (10) | 2% | 2% | 1.27% | 1.47% |
| 101. | Denmark | 2% | 2% | 0.13% | 0.15% |
| 102. | Spain | 2% | 2% | 0.37% | 0.41% |
| 103. | Burkina Faso | 1% | 1% | free | free |
| 104. | United Kingdom | 1% | 1% | 0.22% | 0.25% |
| 105. | Germany | 1% | 1% | 0.28% | 0.34% |
| 106. | Costa Rica | 1% | 1% | free | free |
| 107. | Mali | 1% | 1% | free | free |
| 108. | Peru | 1% | 1% | free | free |
| 109. | Madagascar | 1% | 1% | free | free |
| 110. | Gabon (17) | 1% | 0% | free | free |
| 111. | Mauritania | 1% | 1% | free | free |
| 112. | New Zealand | 1% | 1% | 0.44% | 0.50% |
| 113. | Netherlands | 1% | 1% | 0.77% | 0.79% |
| 114. | Latvia | 1% | 1% | free | 0.02% |
| 115. | France | 1% | 1% | 0.24% | 0.30% |
| 116. | Portugal | 1% | 1% | 0.24% | 0.25% |
| 117. | Iraq | 1% | 0% | 0.09% | 0.15% |
| 118. | Norway (4) | 1% | 1% | 0.39% | 0.42% |
| 119. | Austria | 1% | 1% | 0.38% | 0.45% |
| 120. | Ghana | 1% | 2% | free | free |
| 121. | Italy | 1% | 1% | 0.19% | 0.23% |
| 122. | Finland | 1% | 1% | 0.49% | 0.55% |
| 123. | Rwanda | 0% | 0% | free | free |
| 124. | Ireland | 0% | 0% | 0.50% | 0.52% |
| 125. | Estonia | 0% | 0% | 0.15% | 0.18% |
| 126. | Afghanistan | 0% | 0% | free | free |
| 127. | Uruguay | 0% | 0% | 0.04% | 0.06% |
| 128. | Sweden | 0% | 0% | 0.14% | 0.19% |
| 129. | Switzerland | 0% | 0% | 0.11% | 0.16% |
| 130. | Papua N. Guinea | 0% | 0% | free | free |
| 131. | Cyprus | 0% | 0% | 0.41% | 0.47% |
The average fossil fuel subsidies per capita among the 155 countries in the IMF survey are estimated at $701 in 2015. The figures of the five largest CO2 emitters China, United States, India, Russia and Japan (responsible for 71% of the world’s fossil fuel subsidies in 2015) are as follows, with total subsidies in brackets:
- Russia: $2,334 per capita ($335 billion)
- United States: $2,177 per capita ($699 billion)
- China: $1,652 per capita ($2,272 billion)
- Japan: $1,240 per capita ($157 billion)
- India: $217 per capita ($277 billion)
This quote from the IMF survey (Conclusion), describes the absurdity just fine:
“It is generally in countries’ own interest to move ahead unilaterally with energy subsidy reform. Top subsidizers in percent of GDP and in per capita subsidies stand to gain the most. The benefits will mostly accrue at the local level, by reducing local pollution and generating much needed revenues. Taxing fuels to reflect environmental costs is also straightforward administratively, as it can build off road fuel excises which are well established in most countries. Energy subsidy reform can also contribute to carbon emissions reduction and help countries make pledges ahead of the Paris 2015 UN climate conference. To achieve significant carbon emissions cuts at the global level, it would be essential for top subsidizers in dollar terms to play a leading role.”
¹Global post-tax fossil fuel subsidies, shares of components 2013/2015: 1) Local air pollution: 46.0% (51.6% in 2015), 2) Global warming: 22.3% (23.9% in 2015), 3) Pre-tax subsidies: 11.1% (6.3% in 2015), 4) Foregone consumption tax revenue: 7.5% (5.9% in 2015), 5) Congestion: 6.9% (6.8% in 2015), 6) Accidents: 5.6% (5.1% in 2015), 7) Road damage: 0.5% (0.5% in 2015).
.
The ‘International Monetary Fund’ (IMF) with the ‘Full Study‘ (pdf) and the ‘country database‘ (excel).
Source on CO2 Emissions: EIA, U.S. Energy Information Administration and data on preliminary national CO2 Emissions are from Global Carbon Project (links in the menu “Calculations”).
Drawing by Claus Andersen, 2015.
Comments are closed.