Global CO2 Emissions 1990-2013 (three country groups by income)
2015
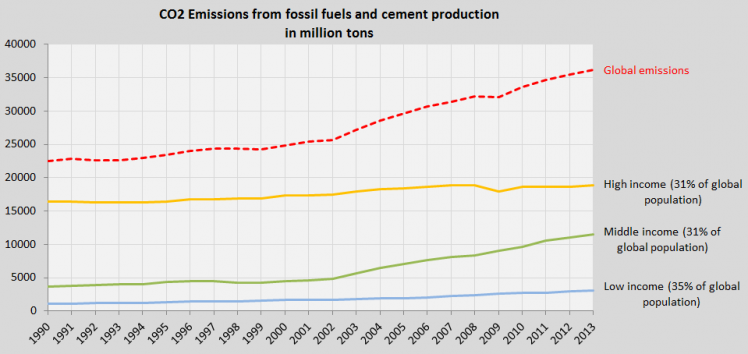
The first diagram shows the global CO2 Emissions from fossil fuels and cement production between 1990 and 2013 (the red dotted line). The trend is of cause outrageous and irresponsible towards future generations.
The other three lines in the diagram show the CO2 Emission trends of three country groups among 147 countries with full data in ClimatePositions, representing 97% of the global population. The three groups are divided by national income per capita in 2012:
Orange line (high income)
- 74 countries with a per capita GDP(ppp-$) between $11,100 and $130,000.
- 31% of the global population.
- CO2 Emissions per capita of 8.6 tons on average in 2012.
- Climate Debt: $4,654 billion (89% of the global Climate Debt).
Green line (middle income)
- 25 countries with a per capita GDP(ppp-$) between $5,500 and $11,000 (China is the wealthiest).
- 31% of the global population.
- CO2 Emissions per capita of 5.1 tons on average in 2012.
- Climate Debt: $573 billion (11% of the global Climate Debt).
Blue line (low income)
- 48 countries with a per capita GDP(ppp-$) between $700 and $5,200 (India is the wealthiest).
- 35% of the global population.
- CO2 Emissions per capita of 1.2 tons on average in 2012.
- Climate Debt: $2-3 billion (below 0.1% of the global Climate Debt).
The three groups of countries all contribute to the increase of emissions over the 23 year period, but the middle income group (the China-group) has accelerated catastrophically since 2002. Looking at the total emissions for the entire period, then the high income group is primarily responsible for the climate destruction, accounting for 69% of all emissions (see below).
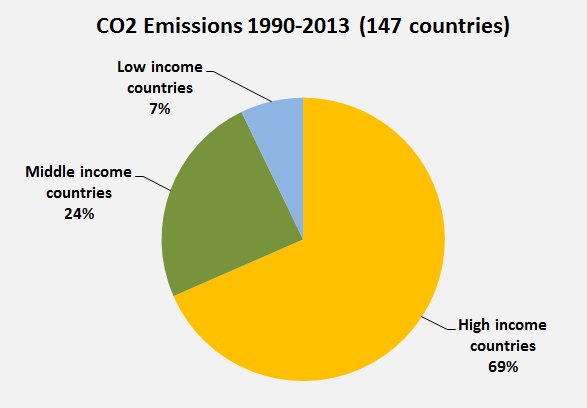
If China instead were defined as high inkomst country, then this group of countries, representing 50% of the world’s population, was responsible for 96% of global CO2 Emissions from fossil fuels in 2012.
.
CO2 Emissions 1990-2013 is from ’Carbon Dioxide Information Analysis Center (CDIAC)’: 2014 Budget v1.1 (May 2015; “Territorial Emissions”)
Information on national GDP(ppp-$) per capita: Worldbank (links in the menu “Calculations”).
Data on national and global Populations: EIA, U.S. Energy Information Administration (links in the menu “Calculations”).
Read also the article: ‘IEA estimate: No reduction of global CO2 Emissions in 2014‘.
Comments are closed.