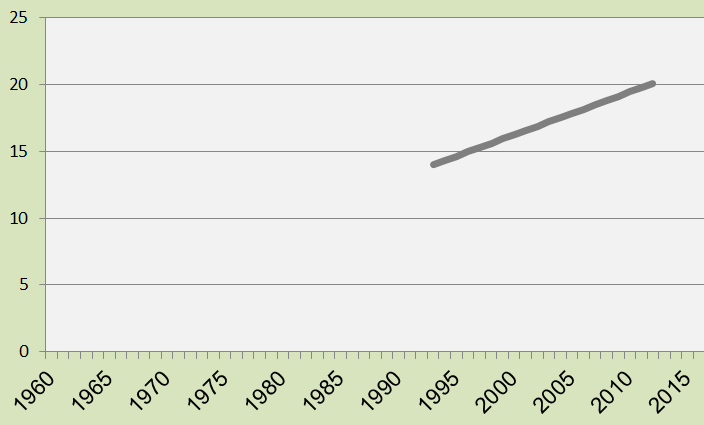
Global Sea Level 1993-2012
22
Sep

2013
The diagram shows the global Sea Level rise between 1993 and 2012. Annually the average increase was 3.2 mm (a total of 6.08 cm in 19 years). The increase between 1880 and 1993 is set to 14 cm (uncertain data). The annually updated Sea Level affects the national Climate Contributions in ClimatePositions.
A hypothetical excample: If the global Sea Level today were the same as in 1993, United States’ total Climate Contribution would be 982 billion US$ in 2012 instead of 1,409 billion – the saving would have been 427 billion US$.
Data on global sea level is from University of Colorado (links in the menu “Calculations”).
Comments are closed.