India keeps the balance between growth and CO2 emissions
2013
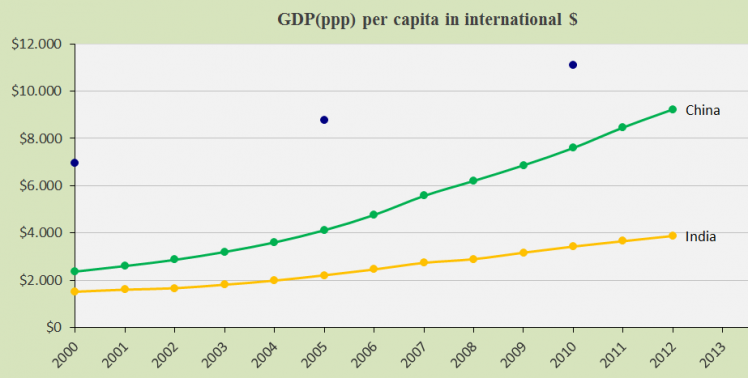
India is the 4th largest CO2 Emitter in the world (in 2006-2010) but Contribution Free due to a balanced increase in economic growth and CO2 Emissions per capita. The front diagram show India’s annual GDP(ppp-$) in comparison with China and the global average (the blue dots). Subject to modifications in the data source. Economic growths in these two countries are causing an increasing proportion of the global CO2 Emissions (28.3% in 2006-2010) and thus climate change.
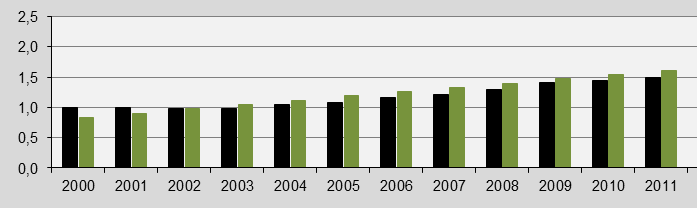
The diagram below illustrates India’s annual CO2 Emissions 2000-2011 (the black bars) and the free CO2 Emission level (the green bars). The free level is calculated by using the indicators in ClimatePositions (see the menu “Calculations/Indicators”). The CO2 Emissions (carbon dioxide) increased from 1.0 tons in 2000 to 1.5 tons in 2011.
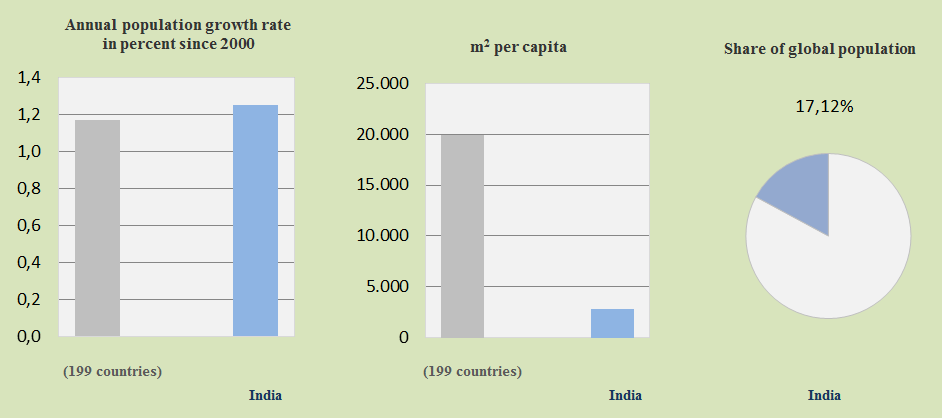
India’s Population represents 17.1% of the Global Population but the growth rate is higher (1.25% annually) – see the diagram below. The Population density is 7 times higher than the global average.
A hypothetical example: If India’s annual CO2 Emissions since 2006 had been at the 2011 level the total national Contribution (climate debt) in 2011 would have been 1.8 billion US$ instead of 0.
Source on CO2 emissions: EIA, U.S. Energy Information Administration (links in the menu “Calculations”).
Information on national GDP(ppp-$) per capita is from Worldbank (links in the menu “Calculations”). Read about GDP+ in the submenu ”Indicators”.
Data on national and global populations are from the EIA, U.S. Energy Information Administration (links in the menu “Calculations”).
Comments are closed.