India – per capita Fossil CO2 Emissions (zero Climate Debt)

2020
In the calculation of Climate Debt, India is especially interesting because it has zero Climate Debt despite the fact that the country is the 3rd largest emitter of Fossil CO2. As it appears, India will enter the next 20-year period in ClimatePositions (2020-2039) without any Fossil CO2 Emissions exceeded. The final calculation will be made, when data on Fossil CO2 Emissions 2019 are released.
The following diagrams expose the trends of Fossil CO2 Emissions, GDP(ppp-$), Ecological Footprint without carbon, Forest Cover and Primary Forest.
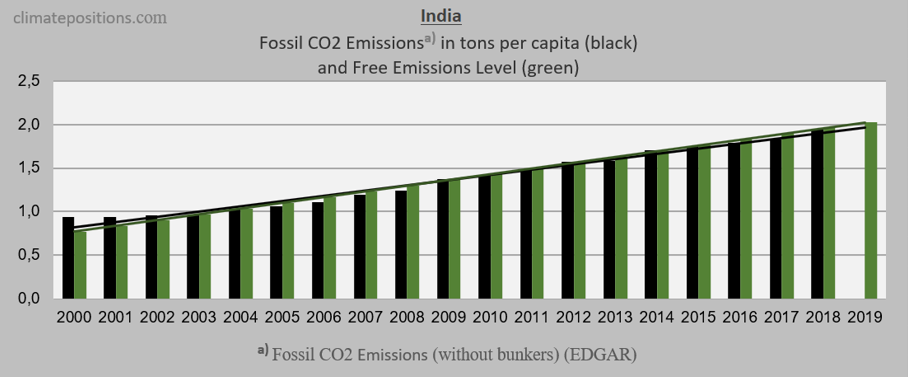
The first diagram shows the Fossil CO2 Emissions per capita annually between 2000 and 2018. The green bars show the Free Emissions Level. Since the black line is slightly below the green line, India has no Climate Debt. The green line, however, is variable according to numerous updated ‘Indicators‘.
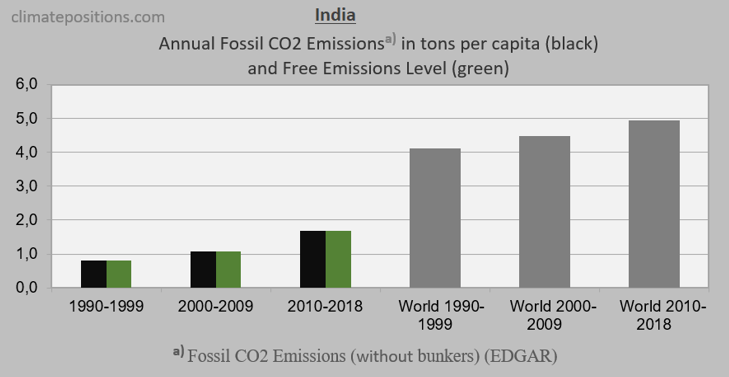
The second diagram shows Fossil CO2 Emissions in tons per capita in decades. Again, the green bars show the Free Emission Level. The grey bars are World Fossil CO2 Emissions average.
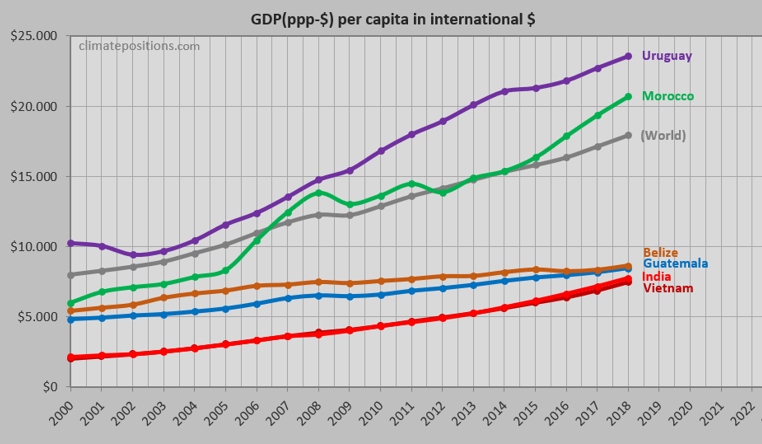
The third diagram shows per capita GDP(ppp-$) of India and the five countries with the smallest Climate Debt among 95 countries: Vietnam, Uruguay, Belize, Guatemala and Morocco (see the ‘Ranking‘).
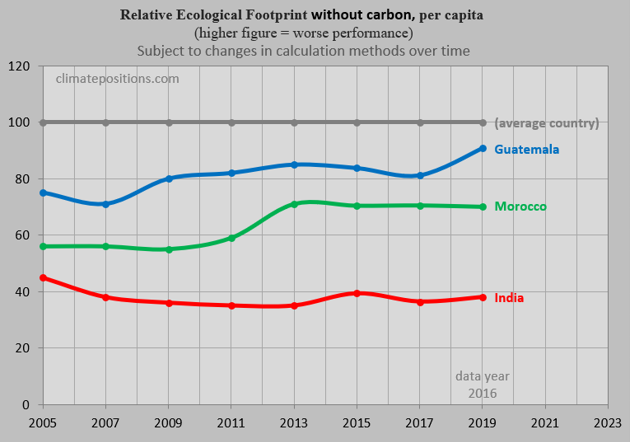
The next diagram shows the relative per capita Ecological Footprint without the carbon footprint of India, Morocco and Guatemala, with an average country among 181 set at 100. Had India performed the same footprint as Morocco during the period, then the Climate Debt would have been $1 per capita ($1.9 Billion in total) instead of zero. Note that data is three years prior to the specified years.
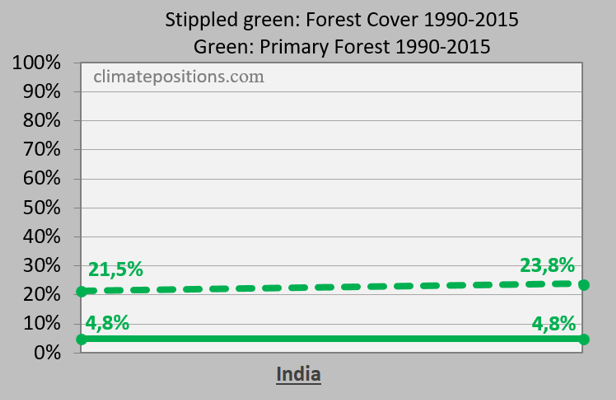
The last diagram shows the changes in Forest Cover and Primary Forest between 1990 and 2015. Global updates are expected in 2020. Had India not increased its Forest Cover by 2.3%, then the Climate Debt would have been $6 per capita ($7.8 Billion in total) instead of zero.
.
Updated data and diagrams of all ‘Indicators‘ and countries in ClimatePositions are available in the sub-menu ‘Calculations (Excel)‘.
Data on Fossil CO2 Emissions (excluding international shipping and aviation) including industrial processes (cement, steel, liming, etc.) are from EDGAR (European Commission) (links in the menu Calculations / Sources & Links). Direct link ‘here‘.
Information on national GDP(ppp-$) per capita: Worldbank (links in the menu Calculations / Sources & Links).
Source on Ecological Footprint: Global Footprint Network (links in the menu Calculations / Sources & Links).
Forest Data on national Forest Cover and Primary Forests are from United Nations UN (Report: Global Forest Resources Assessments) (links in the menu Calculations / Sources & Links).
Drawing/illustration by Claus Andersen, 2020.
Comments are closed.