Indonesia fails on deforestation and CO2 Emissions
2013
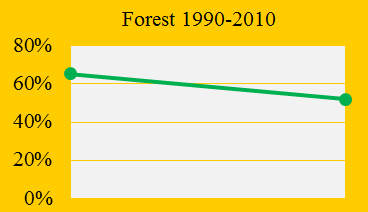
Indonesia was the 73rd worst performing country out of 145 in ClimatePositions 2010 with a total Climate Contribution (climate debt) of 5.6 billion US$. As shown in the front diagram Indonesia cut down the total forest cover (mainly rainforest) from 65.4% in 1990 to 52.1% in 2010. Had Indonesia maintained the forest cover since 1990, then the saving in Contribution would have been 4.6 billion US$. In the updated calculation the Contribution (debt) has increased to 6.5 billion US$.
Indonesia has more than 17,000 islands of which approximately one third are inhabited. The national forests represent 10% of the world’s remaining tropical forests and they are the second largest in the world after the Brazilian. Indonesia is one of the five most species-rich countries in the world, with a high rate of endemic species. Twelve percent of all mammal species, 16% of reptile and amphibian species, and 17% of bird species are found on the islands. In other words, the rapid deforestation in Indonesia is a global disaster. Read more ‘here’.
See the annual CO2 Emissions (carbon dioxide) per capita (the black bars) and the Contribution Free Levels (the green bars) below. Without the cut down in forest cover the national Contribution Free Level in 2011 would have been 1.7 tons of CO2 per capita instead of 1.3 tons.

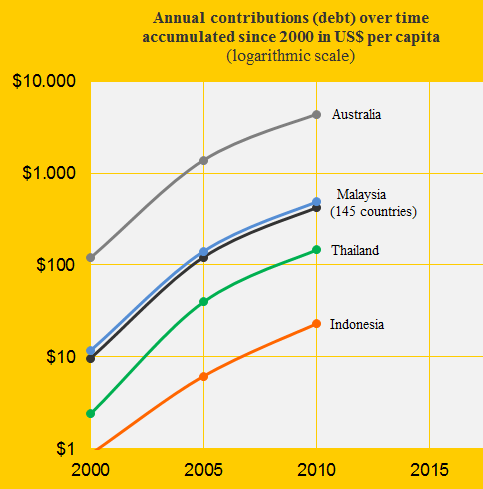
The diagram below shows Indonesia’s Contribution (debt) per capita in 2000, 2005 and 2010 compared to the global average and the worse performing countries Australia, Malaysia and Thailand. All countries are from the same region.
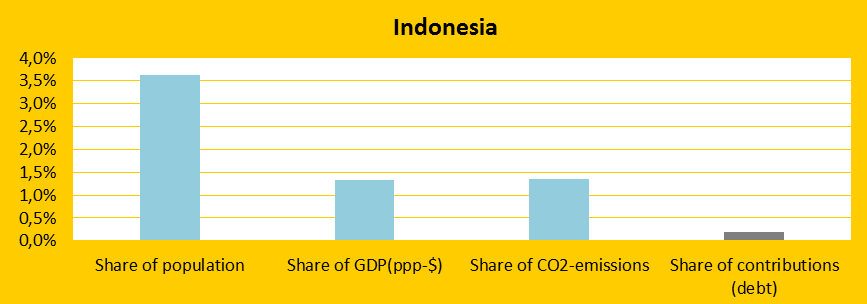
The last diagram (below) is from ClimatePositions 2010 and shows Indonesia’s total share of the global: 1) Population (3.62%), 2) GDP(ppp-$) (1.32%), 3) CO2 emissions (1.35%) and 4) Contributions (0.20%).
Sources on national forest area: United Nations (UN) (links in the menu “Calculations”).
Source on CO2 emissions: EIA, U.S. Energy Information Administration (links in the menu “Calculations”).
Information on national GDP(ppp-$) per capita: Worldbank (links in the menu “Calculations”).
Data on national and global populations: EIA, U.S. Energy Information Administration (links in the menu “Calculations”).
Comments are closed.