Indonesia’s Climate Debt, rainforests, waters and greenhouse gas emissions

Indonesia’s current Climate Debt, accumulated since 2000, is $123 per capita (‘ranks’ 67th among 148 countries, by January 2016). The total Climate Debt is $31 billion (‘ranks’ 25th). However, looking at the entire level of greenhouse gas emissions, Indonesia is estimated to be the world’s 3rd largest emitter¹, with the large majority of its emissions coming from rainforest and peatland degradation and loss. Today, around 5% of the global greenhouse gas emissions are coming from Indonesia, with its 3.7% share of the global population. The following examines the indicators of CO2 Emissions, Forest Cover, Primary Forests and GDP(ppp-$), and other warming-related topics such as forest fires, oil palms and ecosystems.
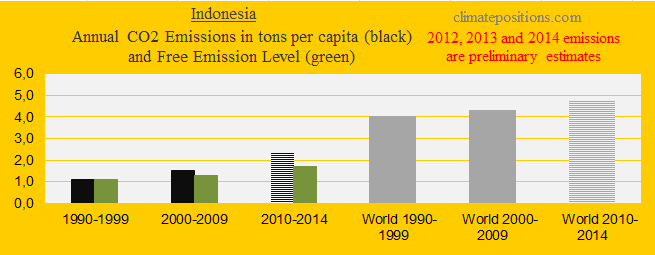
The first diagram shows Indonesia’s per capita CO2 Emissions from fossil fuels (without bunker fuels) and cement production in decades in comparison with the world average. CO2 Emissions since 2012 are preliminary estimates. The green bars are the Climate Debt Free Level, determined by the level of CO2 Emissions in the 1990s and a number of continuously updated ‘indicators’. The Indonesian CO2 Emissions accounted for 1.6% of the world’s CO2 Emissions in 2011 and 1.8% in 2014 (preliminary).
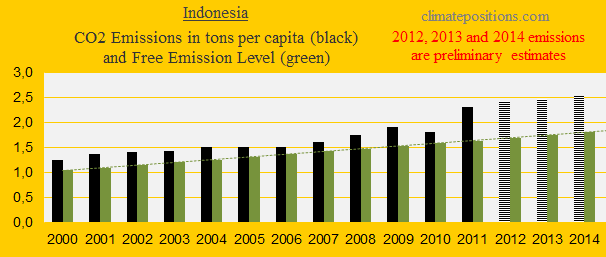
The next diagram shows the per capita CO2 Emissions from fossil fuels (without bunker fuels) and cement production since 2000. CO2 Emissions in 2012, 2013 and 2014 are preliminary estimates. The Climate Debt Free Level (the green bars) increases from 1.0 tons in 2000 to 2.1 tons by 2019. However, the actual Indonesian increase-rate so far is considerably higher.
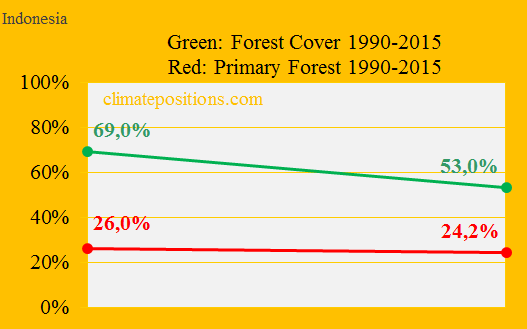
As recently as the 1960s, about 80% of Indonesia was covered with forest – and the population was one third of today in 1960. The diagram below shows the Forest Cover (green) and precious Primary Forests (red) as percentages of the total land area, between 1990 and 2015. The loss of Forest Cover and Primary Forests since 1990, accounts for 45% of the Indonesian Climate Debt (the Forest Cover loss alone accounts for 41%).
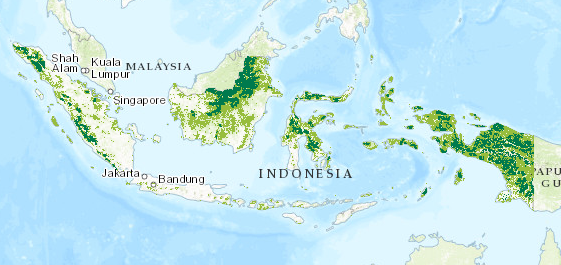
Primary Forest is defined as naturally regenerated forest of native species, where there are no clearly visible indications of human activities and the ecological processes are not significantly disturbed. Nevertheless, the map below from ‘fires.globalforestwatch.org’ displays the locations of Primary Forests separated into two categories: 1) Intact (dark green), and 2) Degraded (light green). This indicates an even more catastrophic loss of world heritage rainforests than the overall figures show.
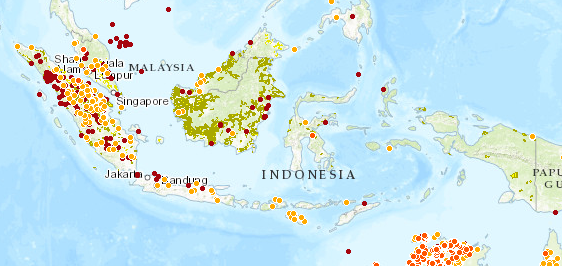
The second map from the same interactive site displays the locations of one week (end of June 2016) of wild fires separated into two categories: 1) NASA, MODIS, resolution 1000×1000 m (yellow dots), and 2) NASA, VIIRS, 375×375 m (red). The map also shows oil palm plantations (light green and yellow). Both continuing new forest fires and expansion of oil palm plantations are serious threats to the Indonesian rainforests.
The high frequency of seasonal forest fires in Indonesia is mostly caused by the forest clearance method called “slash and burn”, where land is set on fire to clear it for new planting. Much of the cleared land is drained carbon-rich peat soil which is highly flammable, and the fires are easily spread and difficult to stop – peat soil can burn meters underground (30% of Indonesia’s forests are peatland). According to World Resources Institute more than a third of the fires in Sumatra are occurring on pulpwood concessions and a good proportion of the rest are on or near land used by palm oil producers (sources: ‘The Guardian’ and ‘voanews.com’). Indonesia is the world’s largest producer of pulpwood, timber and palm oil (source: ‘The Guardian’).
The Coral Triangle is a triangular area of tropical marine waters of Indonesia, Malaysia, Papua New Guinea, Philippines, Solomon Islands and Timor-Leste, which is recognized as the global center of marine biodiversity and a global priority for conservation. Read this statement about one marine area protected back in 2007, at ‘Natuna Islands’ (quote from ‘blog.conservation.org‘):
“… so far this [protected area] has no established management — there is no staff to patrol the park, no designation of which areas can be used for which activities, or allocated budgets to ensure the waters are actually being protected. In fact, an in-depth marine assessment had never been conducted around the Natuna Islands [..]. What we found revealed the precarious state of the environment in this isolated part of the world: highly dependent fishing communities, dwindling fish populations and a slew of pressures that are negatively impacting the quality of these waters and raising concern for the future of the local communities that rely on them. Here are some of our major findings: Fish biomass and coral cover have both steadily declined since 2004. The average percentage of hard coral cover within the sites surveyed was 23%, a less than ideal level. As we dived amongst charismatic species like sea turtles [..] we saw clear evidence of coral bleaching and rubble indicating coral reef degradation. With external pressure such as overfishing and sedimentation from development, the coral reefs surrounding Natuna are under extreme pressure from unsustainable practices like overfishing, bomb fishing, trash and urban growth. Only 1% of fish surveyed were longer than 30 centimeters (12 inches). This signifies that fish populations are not reaching maturity — possibly due to overfishing activities, the sharp decline in overall marine health or improper fisheries management. Without an intervention, it is likely that these sites will continue to degrade.”
Due to overfishing, destructive fishing methods, coastal development, pollution and climate change 19% of the world’s coral reefs have already disappeared and scientists consider approximately 75% of the remaining reefs to be threatened, a number that is projected to increase to 90% by 2050 if the negative development continues (source: ‘blog.conservation.org‘).
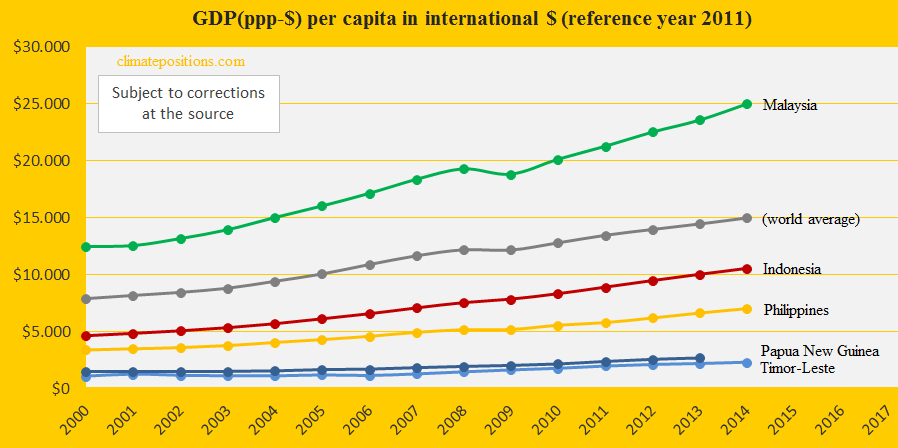
The last diagram shows Indonesia’s development of GDP(ppp-$) per capita since 2000, in comparison with other Coral Triangle countries: Malaysia, Philippines, Papua New Guinea, Timor-Leste, and the world average. Ecosystems account for about 21% of Indonesia’s GDP (source: ‘ran.org’).
.
¹Source: ’ran.org‘..
Updated data and diagrams of all ‘Indicators‘ and all countries in ClimatePositions are available in the menu ‘Calculations (Excel)’.
Data on carbon emissions (CO2 Emissions) from fossil fuels (without bunkers) and cement production are from Global Carbon Project (CDIAC); (links in the menu “Calculations”).
Sources on national forest cover and primary forests: United Nations (UN) (Report: Global Forest Resources Assessments) (links in the menu “Calculations”).
Sources on national marine protections: United Nations (UN) (links in the menu “Calculations”).
Information on national GDP(ppp-$) per capita: Worldbank (links in the menu “Calculations”).
Drawing by Claus Andersen, 2016.
Forest fires in Indonesia: ‘http://www.theguardian.com/sustainable-business/2015/nov/11/indonesia-forest-fires-explained-haze-palm-oil-timber-burning‘(November 2015).
Wild fires, interactive map: ‘http://fires.globalforestwatch.org/map/#activeLayers=primaryForests&activeBasemap=topo&x=111&y=2&z=5‘.
New team trying to stop massive Indonesian wildfires: ’http://www.voanews.com/content/indonesia-wildfires/3343580.html‘ (May 2016).
Palm oil and wildfires: ’https://www.theguardian.com/environment/2016/may/25/indonesia-refuses-palm-oil-permits-in-anti-haze-push‘ (May 2016).
Wildfires: ’http://www.theguardian.com/environment/ng-interactive/2015/dec/01/indonesia-forest-fires-how-the-years-worst-environmental-disaster-unfolded-interactive‘ (December 2015).
Global wildfires and global warming, study: ‘http://rstb.royalsocietypublishing.org/content/371/1696/20150345‘ (May 2016).
Indonesia’s rainforests: ‘http://www.ran.org/indonesian-rainforests‘.
Indonesia’s marine waters: ‘http://blog.conservation.org/2016/01/in-indonesia-marine-park-survey-finds-troubled-waters/‘ (January 2016).
Wikipedia, Coral Triangle: ‘https://en.wikipedia.org/wiki/Coral_Triangle‘.
Comments are closed.