Japans Climate Debt after the Nuclear Power shutdown
In 2010 near 27% of Japans electricity supply was generated by Nuclear Power – in 2012, shortly after the Fukushima nuclear disaster in 2011, the percentage was below 2%. How did Japan respond to this energy shock and how did it influence the Climate Debt in ClimatePositions? The following examines the Nuclear Power (and electric energy mix), CO2 Emissions, GDP(ppp-$) and Climate Debt.
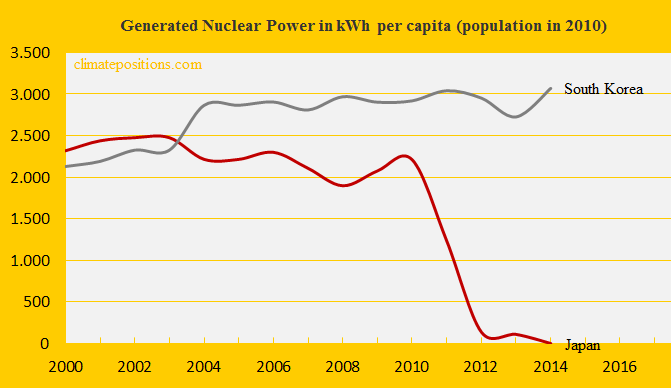
The first diagram shows Japans per capita Nuclear Power generation since 2000 in comparison with South Korea. In 2010 Japan was the 9th largest per capita generator in the world and in 2014 the generation was zero. In 2012-2013 the government temporarily restarted 2 (at Oi) out of 50 reactors to prevent power shortage.
The table below compares the energy mix in 2010 with the one from 2012, that is, before and after the nuclear disaster. Note that the total net generation dropped by 7.4% during the same period. The energy gap (set at 100%) after the Nuclear-shutdown was filled out as follows: Reduced electric generation 23%, Fossil Fuels 72% and Renewable Energy 5%.
| . | 2010 | 2012 |
| . | . | . |
| Nuclear Power | 26.8% | 1.8% |
| Fossil Fuels | 62.3% | 85.8% |
| Renewable/Hydroel. | 7.8% | 7.7% |
| Renewable/ None-Hydroel. | 3.2% | 4.9% |
Regardless widespread public opposition the Japanese government has restarted three nuclear reactors since August 2015 and is planning to restart a total of 37 reactors by 2020. Nuclear Power produce dangerous radioactive waste to deal with for thousands of future generations (between 10,000 and 250,000 years) which of cause is ethically unacceptable.
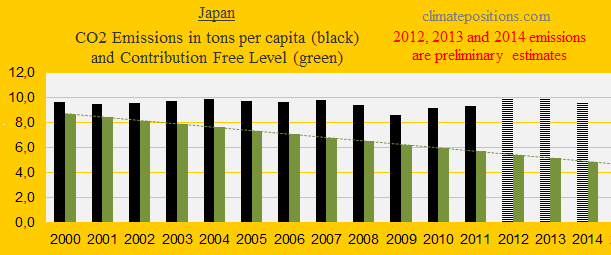
The next diagram shows the per capita CO2 Emissions from fossil fuels (without bunker fuels) and cement production since 2000. CO2 Emissions in 2012, 2013 and 2014 are preliminary estimates. The estimated emissions for the last three years indicate an average increase of 7.3% compared to 2010 – because Fossil Fuels has replaced most of the Nuclear Power generation to close the energy gap.
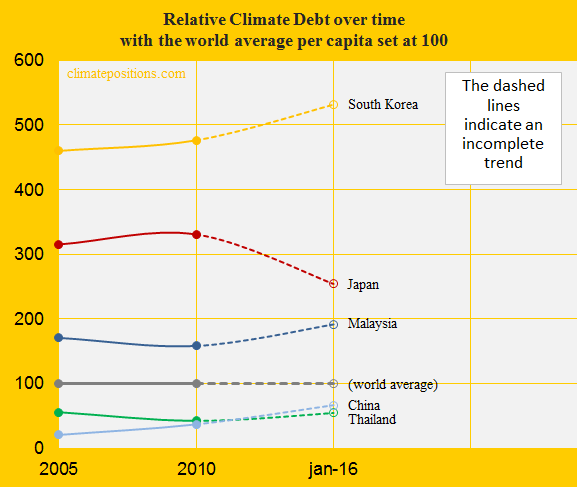
In ClimatePositions reductions of both CO2 Emissions and Nuclear Power limits the accumulated Climate Debt. Therefore the growing Japanese CO2 Emissions since 2010 is contra-balanced by the shutdown of Nuclear Power in the calculation of Climate Debt. The diagram below shows the per capita Climate Debt since 2000 of Japan, China, South Korea, Malaysia, Thailand, with the world average set at 100. Among these countries only Japan has improved relatively since 2010 – in spite of the growing CO2 Emissions. In real money the accumulated total Japanese Climate Debt increased from $161,552 billion in 2010 to $267,183 billion by January 2016 (ranks 3rd; see the latest ‘ranking’). In 2010 Japans share of the fast growing global Climate Debt was 6.24% and by January 2016 it had decreased to 4.70% (see the latest ‘ranking’).
Note that payments to global climate funds have been deducted from the Climate Contribution to reach the Climate Debt. The Japanese climate change funding amounted $1.6 billion, or $13 per capita, by November 2015.
In 2014 Japan was the 24th wealthiest country among 148 with full data in ClimatePositions. The diagram below shows the development since 2000, in comparison with China, South Korea, Malaysia, Thailand and the world average.
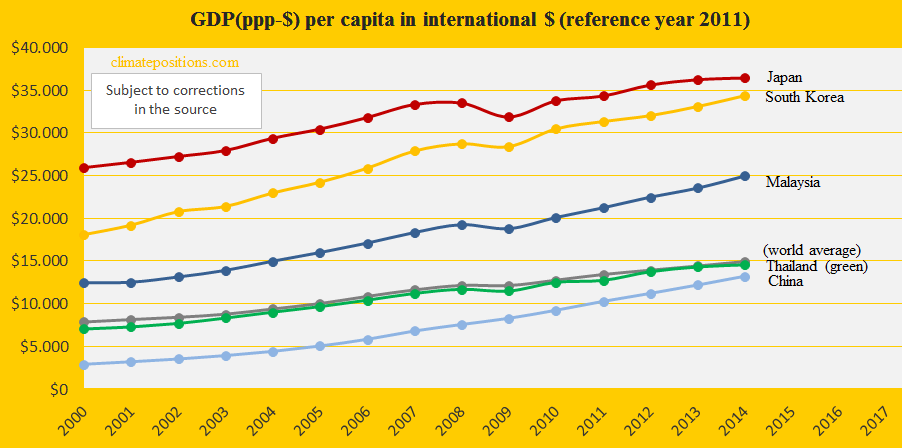
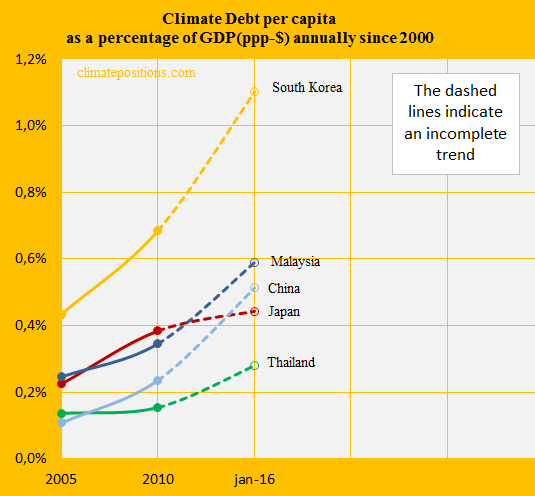
January 2016 the Climate Debt per capita of Japan was $2,102 and the ‘ranking’ was 19th. The Climate Debts share of the GDP(ppp-$), annually since 2000, was 0.44%. The development since 2005 is shown in the diagram below, along with the same group of countries. Once again the Japanese trend since 2010 stands out positively among the five.
.
Hypothetical example no 1: If Japan had continued with the 2010-level of Nuclear Power generation and CO2 Emissions until today, then the total accumulated Climate Debt would have been $269.2 billion instead of the current $268.9 billion (0.1% increase).
Hypothetical example no 2: If Japan had continued with the 2010-level of CO2 Emissions until today, while shutting-down Nuclear Power generation, then the total accumulated Climate Debt would have been $256.5 billion instead of the current $268.9 billion (4.6% decrease).
.
Information on national GDP(ppp-$) per capita: Worldbank.
Data on carbon emissions (CO2 Emissions) from fossil fuels (without bunkers) and cement production are from Global Carbon Project (CDIAC); (links in the menu “Calculations”).
Data on national Nuclear Power generation: World Nuclear Association (links in the menu “Calculations”).
Source on climate change funding (financing) is from Climate Funds Update (links in the menu “Calculations”).
Background information on Japans Nuclear Power:
‘http://www.theguardian.com/world/2015/oct/15/japan-restarts-second-nuclear-reactor-despite-public-opposition‘
‘http://www.bloomberg.com/news/articles/2016-01-28/japan-inches-closer-to-nuclear-revival-as-third-reactor-restarts‘
‘http://www.japantimes.co.jp/opinion/2016/02/10/editorials/takahamas-problematic-restart/#.VsQeWPLhDIU‘
PowerPoint collage by Claus Andersen, 2016.
Comments are closed.