Mexico – the world’s 14th largest CO2 emitter (with an enormous solar potential)

Mexico’s current Climate Debt is $346 per capita and the ‘Ranking’ was 56th among 148 countries by January 2016. The following examines the Mexican CO2 Emissions, Climate Debt, Environmental Performance and GDP(ppp-$), in comparison with the United States, China, Brazil and Germany.
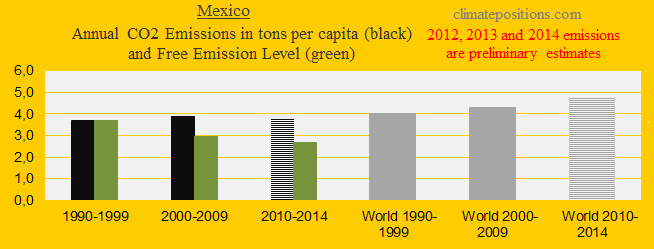
The first diagram shows the Mexican per capita CO2 Emissions from fossil fuels (without bunker fuels) and cement production in decades in comparison with the world average. CO2 Emissions since 2012 are preliminary estimates. From 3.7 tons in the 1990s the level increased slightly to 3.8 tons on average between 2000 and 2014 (preliminary). The green bars are the Climate Debt Free Level in ClimatePositions, determined by the level of emissions in the 1990s and a number of continuously updated ‘Indicators’.
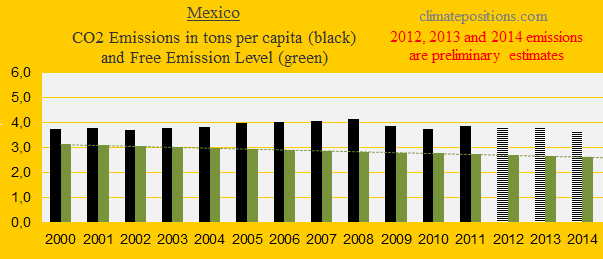
The diagram below shows the per capita CO2 Emissions from fossil fuels (without bunker fuels) and cement production since 2000. Emissions in 2012, 2013 and 2014 are preliminary estimates.
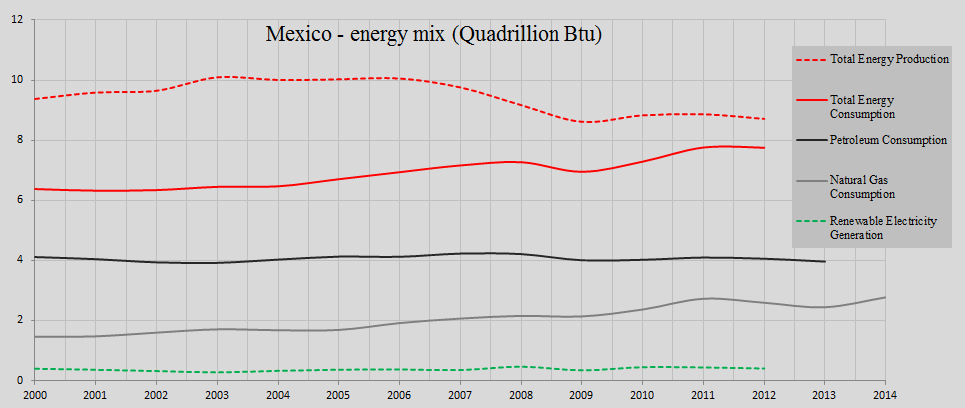
Mexico was the world’s 10th largest oil producer in 2014 and the 5th largest in 2004 – the production dropped by 27% during this period. The diagram below shows the energy mix since 2000. The overall growth in energy consumption has almost entirely been covered by natural gas. The renewable electricity generation amounted 4.8% of the energy production in 2012, compared to 4.4% in 2000. Note that the convenient hydroelectricity amounted 72% of the renewable electricity generation in 2012, whereas solar electricity amounted only 0.16%. However, the principal solar energy technologies in Mexico have traditionally been ‘non-electric solar systems’ for space heating, water heating and drying crops. Mexico has the world’s third largest solar potential which corresponds to about 50 times the national electricity generation (in 2010).
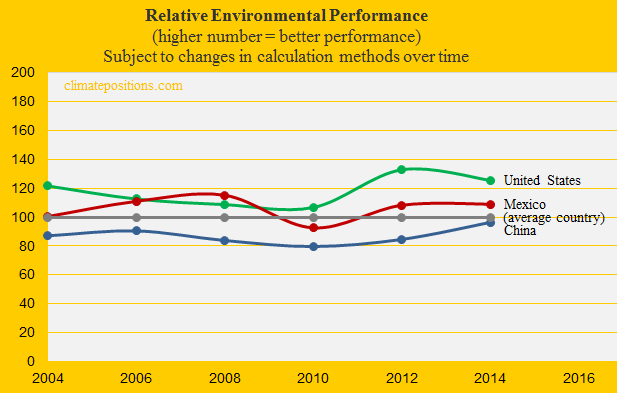
The relative Environmental Performance over time of Mexico, the United States and China, with the world’s average set at 100, is shown below. The ‘Environmental Performance Index’ published January 2016 (data-year is set at 2014 in the diagram) ranks Mexico 67th among 180 countries. See ‘Details on the Mexican performance’.
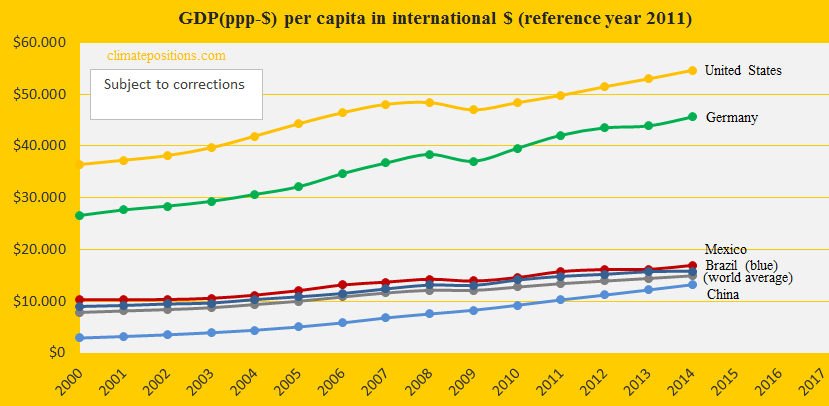
The next diagram shows the development of GDP(ppp-$) since 2000, in comparison with the United States, China, Brazil, Germany and the world average. Mexico follows the world-trend at a slightly higher level.
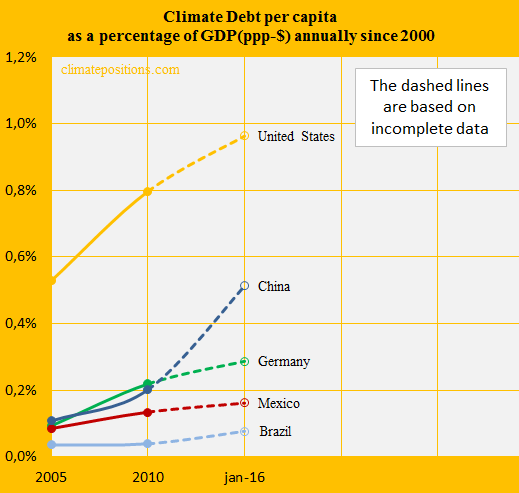
By January 2016 Mexico’s Climate Debt’s share of the GDP(ppp-$), annually since 2000, was 0.16% and the ‘Ranking’ was 55th; in 2010 the ranking was 52nd. The performance since 2005 is shown in the diagram below along the same group of countries.
.
Updated data and diagrams of all ‘Indicators‘ and all countries in ClimatePositions are available in the menu ‘Calculations (Excel)’.
Data on carbon emissions (CO2 Emissions) from fossil fuels (without bunkers) and cement production are from Global Carbon Project (CDIAC); (links in the menu “Calculations”).
Data on energy consumption and production is from ‘U.S. Energy Information Administration (EIA)’. Information on solar energy are from Wikipedia ‘1‘ and ‘2‘.
Source on Environmental Performance: Yale and Columbia University reports, published 2006-2016 (links in the menu “Calculations”).
Information on national GDP(ppp-$) per capita: Worldbank (links in the menu “Calculations”).
PowerPoint image by Claus Andersen, 2016.
Comments are closed.