Per capita fossil fuel Carbon Dioxide Emissions: China vs. United States

2015
In different ways, China and the United States are main responsible for the continuing Climate Destruction. Combined the two superpowers, holding 24% of the world population, emitted 43% of the global CO2 from fossil fuels in 2012 and they accounted for 47% of the global Climate Debt¹. Had the two countries consistently promoted a fair and globally binding climate agreement, not thwarted it, then COP21 in Paris in December would not be such an incomprehensible mission impossible². The diagram below shows the per capita fossil fuel carbon dioxide emissions, between 1980 and 2013, of China, the United States and Rest World. The stippled lines indicate the Contribution Free Level of CO2 Emissions in ClimatePositions. More comments below the diagram.
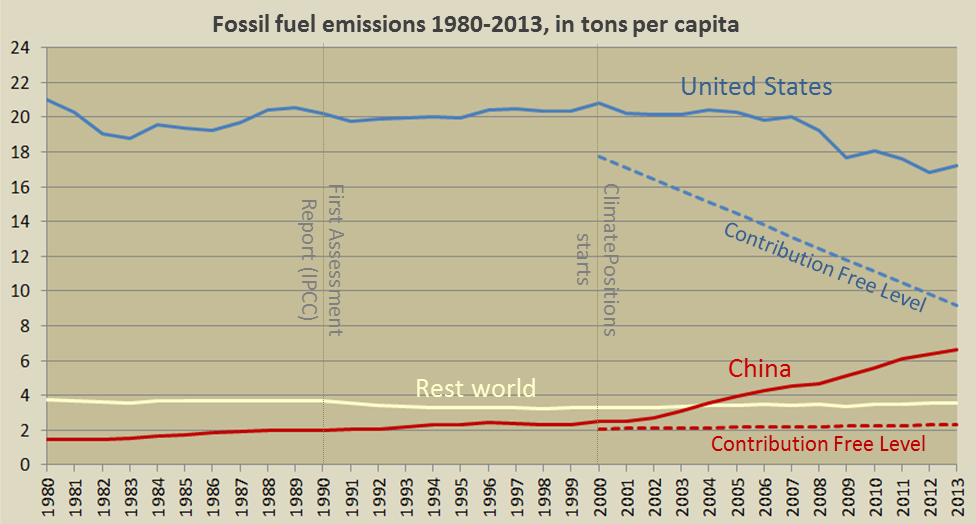
As it shows, the relatively poor China could have increased per capita emissions slightly since 1990s and still be Contribution Free (8% increase by 2020 compared to 1990s is considered acceptable). However, the Chinese increase rate has been appallingly high since 2002. The reduction rate since 2005 of the rich United States has been way too little and especially too late (74% reduction by 2020 compared to 1990s is considered acceptable). Note that the average per capita emissions of Rest World is about unchanged since 1980. The overall ‘global increase of CO2 Emissions’ is largely due to a 21% growth of the global population since 1995. For comparison, the Chinese population growth was only 10% during the same period, due to a harsh birth control, whereas the growth of the United States was 18%.
The table below shows the indicator values and key calculations of China and the United States. The updated indicator values have a direct impact on the Contribution Free Level of CO2 Emissions (the stippled lines in the diagram above) and consequently the size of the Climate Debt. Detailed information is available in the menu’s ‘Calculations (excel)’ and ‘Indicators’.
| . | China | United States |
| Population 2012, Millions | 1,343 | 314 |
| Environmental Performance | 85 | 117 |
| Ecological Footprint, excl. CO2 | 65 | 185 |
| Forest and Sea | 5.2 | 1.7 |
| Nuclear Power, 1992-1999 | 0.0 | 0.6 |
| Nuclear Power, 2000-2014 | 0.0 | 0.6 |
| GDP+ (ppp-$), per capita | $8,184 | $47,671 |
| Climate Funding, per capita | $0.01 | $4.86 |
| CO2 exceeded, tons per capita | 31 | .80 |
| Climate Debt, billion | $566 | $1,995 |
| Climate Debt per capita | $422 | $6,358 |
| Price per tons CO2 since 2000 | $6.85 | $23.70 |
| Funding share of Climate Debt | 0.00% | 0.12% |
¹The Climate Debt in ClimatePositions (calculations are available ‘here‘). Climate change funding (deposited) to developing countries has been deducted. See the ‘ranking‘ of world shares.
²While the majority of rich countries with huge per capita emissions of greenhouse gases contribute inexcusably inadequate in the 2015-submissions prior to COP21, then the majority of poor countries with no historic responsibility for the global warming contribute with heartbreaking reduction commitments in comparison with fictional ‘BAU-scenarios‘ (business-as-usual scenarios). A preliminary ‘calculation by Climate Interactive’ indicate that the realization of the present submissions will lead to a global temperature rise of 3.5oC (with a range of uncertainty of 2.1 – 4.6°C) at the end of the century … when todays new-born babies are in their 80s. Read also the article: ‘Giving up on future generations is real (about COP Submissions 2015)‘.
.
If the United States had increased its Forest Cover by 5.2% (instead of only 0.9%) since 1990, as China, then the total accumulated Climate Debt of the United States would have been $1,767 billion instead of $1,996 billion – a reduction of $229 billion, or 11%.
If China’s Environmental Performance had been as high as the one of the United States, then the total accumulated Chinese Climate Debt would have been $528 billion instead of $566 billion – a reduction of $68 billion, or 12%.
.
Source on CO2 Emissions: EIA, U.S. Energy Information Administration and data on preliminary national CO2 Emissions are from Global Carbon Project (links in the menu “Calculations”).
Data on national and global Populations: EIA, U.S. Energy Information Administration (links in the menu “Calculations”).
First diagram (with words and flags) by Claus Andersen, 2015.
Comments are closed.