Saudi Arabia’s climate destruction proceeds (bankruptcy is a ship on the horizon, though)
The per capita Climate Debt of Saudi Arabia accumulated since 2000 is now $7,251 which ranks the wealthy oil-state 6th among 148 countries. The Saudi climate change financing to developing countries is zero dollars.
The first diagram (below) shows Saudi Arabia’s per capita CO2 Emissions from fossil fuels (without bunker fuels) and cement production in decades in comparison with the world average. CO2 Emissions since 2012 are preliminary estimates. The green bars are the Contribution Free Level, determined by the level of CO2 Emissions in 1990s and a number of continuously updated ‘Indicators’. The Saudi emissions were 13.8 tons annually in the 1990s, on average, and 18.7 tons between 2010 and 2014 (preliminary). 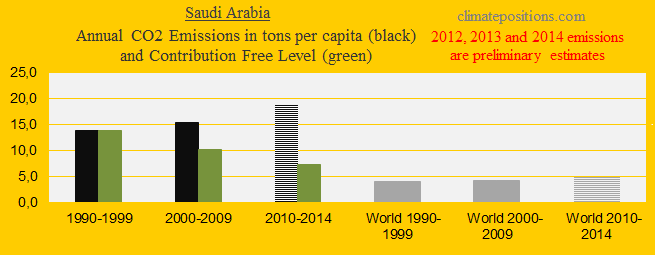
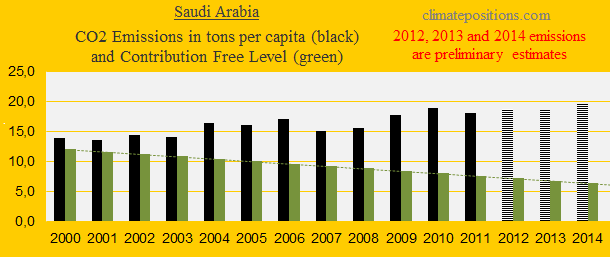
The next diagram shows the per capita emissions (without bunker fuels) since 2000; emissions from 2013 and 2014 are preliminary estimates. Renewable energy’s share of the total electric generation increases from zero in 2011 to 0.0004% in 2012 (0.00004% of the total energy production).
According to ‘Saudi Arabia’s COP21 Submission’ the Kingdom “seek to achieve” reductions of up to 130 million tons of CO2eq by 2030 annually (about 22% reductions¹ by 2030 compared to 2014). However, these reductions are “contingent on the Kingdom’s economy continuing to grow” and a continuing “robust contribution from oil export revenues to the national economy.” The reductions are also “premised on the fact that the economic and social consequences of international climate change policies and measures do not pose disproportionate or abnormal burden on the Kingdom’s economy.” In other words: Saudi Arabia will (perhaps) reduce emissions moderately unless it harms its economy! February 2016 the Saudi oil minister of the world’s largest oil producer said these disturbing words: “For too long the oil industry has been portrayed as the Dark Side, but it is not. It is a force, yes, but a force for good.” (‘The Guardian’)
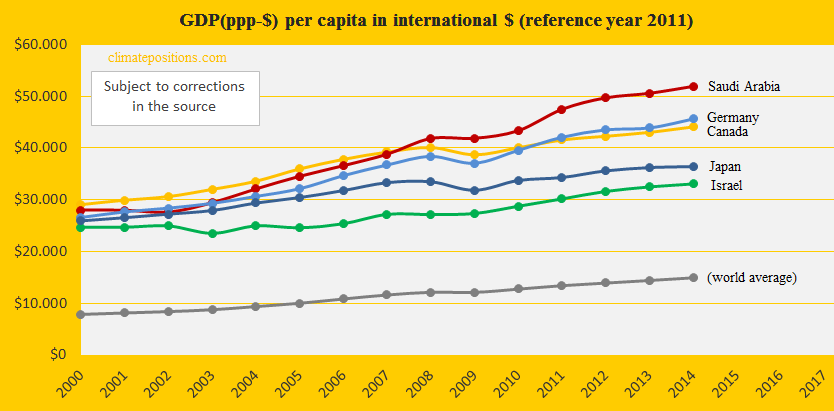
The diagram below shows the per capita GDP(ppp-$) since 2000 of Saudi Arabia, Japan, Germany, Canada, Israel and the world average. Back in 2000, the wealth of the four countries was more even than in 2014.
Being the world’s largest oil-producer for decades the Saudi royal family is accustomed to an extravagant lifestyle; and looked upon as the generous benefactor of privileges to its 31 million people: No income tax occur (only a religious levy) and gasoline is subsidized by $52 billion a year (about $1,700 per capita) and therefore it costs only around 16 cents per liter. Saudi Arabia has around $664 billion of foreign assets (more than $21,000 per capita) and to defend all this wealth, ‘Saudi Arabia spends more than 80 billion on military’ ($2,600 per capita) which is by far the highest per capita military expenditure in the world.
However, the global rout of oil prices changes everything for Saudi Arabia. Reserves at the central bank dropped 10% in a year (more than $70 billion down) and according to the International Monetary Fund (IMF) Saudi Arabia faces financial ruin if it fails to undergo severe measures in the coming years, as the oil price continues to fall (‘Source: ‘Bloomberg’). ‘CNBC’ has estimated that the Kingdom will be broke in 2018, based on oil at $40 a barrel and no cuts in public spending. Some analysts suggest that prices might fall as low as $10 a barrel from more than $100 in June 2014. Still, bankruptcy is only a ship on the horizon.
So far, the Saudi oil production has increased while prices have dropped. However, ‘Saudi Arabia along with Qatar, Russia and Venezuela announced recently’ that they have frozen their oil production at the level of January 2016 … will oil prices rise?
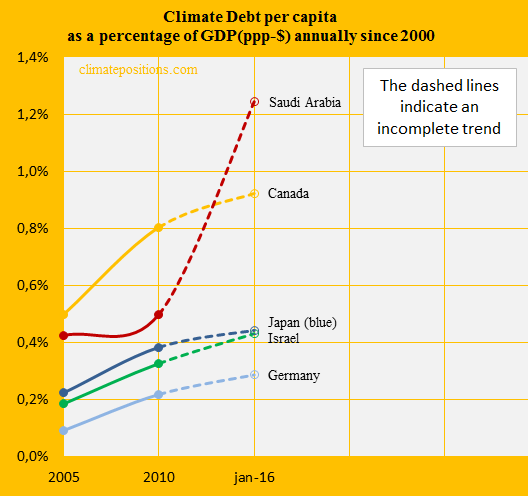
Saudi Arabia’s Climate Debts share of the GDP(ppp-$) was 1.24% annually since 2000 (ranks 5th; see the ‘Ranking’). Even compared large CO2 emitters such as Japan, Germany, Canada and Israel; the Saudi performance is deprived. The appalling development since 2005 is shown in the diagram.
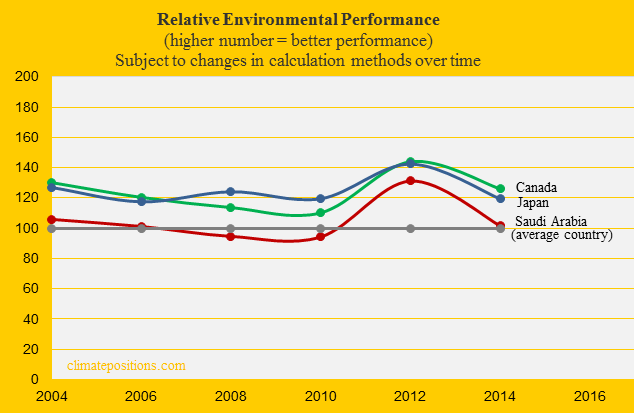
The relative Environmental Performance over time of Saudi Arabia, Japan and Canada, with the world’s average set at 100, is shown below. The ‘Environmental Performance Index’ published January 2016 (data-year is set at 2014 in the diagram) ranks Saudi Arabia 95th among 180 countries. See ‘Details on the Saudi performance’. The previous ‘Index published in 2014’ ranked Saudi Arabia 35th. Note that Environmental Performance Index and Ecological Footprint Network provide completely different rankings and trends due to a different focus.
.
¹Calculated (by me) as if the entire 130 million tons of CO2eq would be reduced on CO2 Emissions from fossil fuels (without bunker fuels) and cement production.
.
A hypothetical example: If Saudi Arabia dropped both its military spending and gasoline subsidies entirely for one year and used the money on climate financing to developing countries instead, then the total Climate Debt accumulated since 2000 would decrease from $224 billion to $132 billion (41% decrease).
.
Data on carbon emissions (CO2 Emissions) from fossil fuels (without bunkers) and cement production are from Global Carbon Project (CDIAC). Data on population is from Worldbank. Links are available in the menu “Calculations”.
Information on national GDP(ppp-$) per capita: Worldbank (links in the menu “Calculations”).
Source on Environmental Performance: Yale and Columbia University reports, published 2006-2016 (links in the menu “Calculations”).
Data on energy production is from ‘U.S. Energy Information Administration (EIA)’.
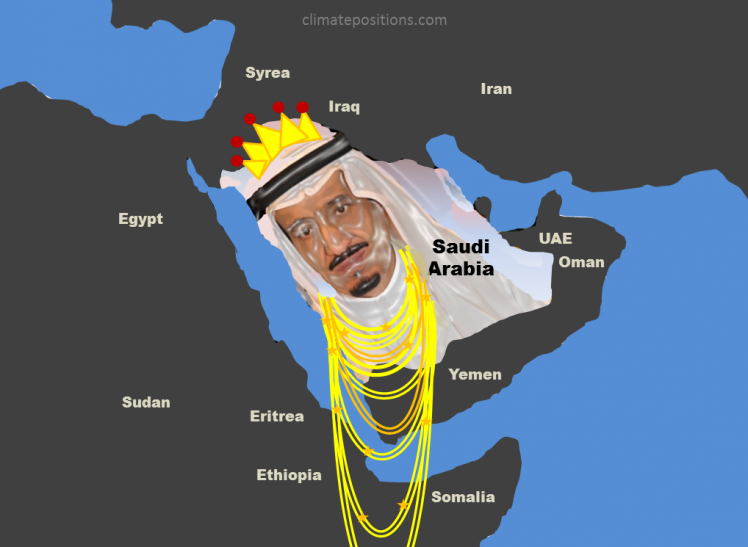
PowerPoint collage of Saudi Arabia (extravagant lifestyle of King Salman bin Abdulaziz bin Abdul Rahman bin Faisal bin Turki bin Abdullah bin Mohammed bin Saud and others) by Claus Andersen, 2016.
Comments are closed.