Sea Level update 2013
2014
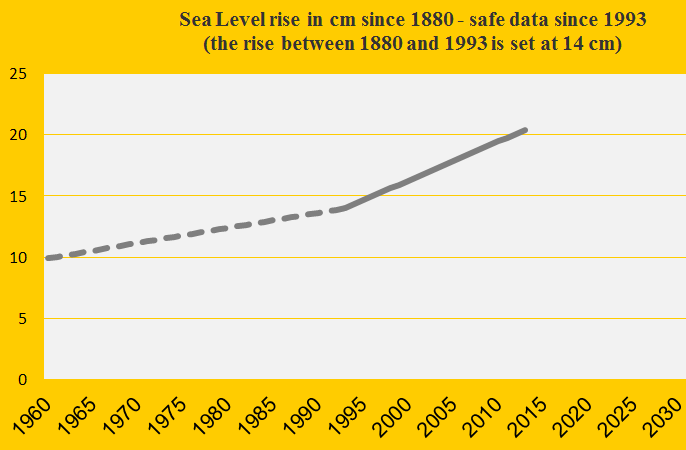
The measurements of global Sea Level are very complicated and end up in a single figure for average annual Sea Level rise since 1993. From 2012 to 2013, the increase rate is unchanged 0.32 cm annually (since 1993). The total increase between 1880 and 1993 is set at 14 cm (with uncertainty). This adds up to a total Sea Level rise from 1880 to 2013 at 20.40 cm – the figure used in ClimatePositions. See the development in Sea Level 1960-2013 in the diagram (the level in 1880 is set at 0).
The national Climate Contributions increase along with the Sea Level update in ClimatePositions. Here are two examples with the latest update: The Algerian Climate Contribution (climate debt) increased from $21.97 per capita to $22.32 and Finland’s increased from $2,082 per capita to $2,116. See a graphic presentation of the calculation ‘here‘.
Comments are closed.