Sea Level update 2014
12
Jan
2015
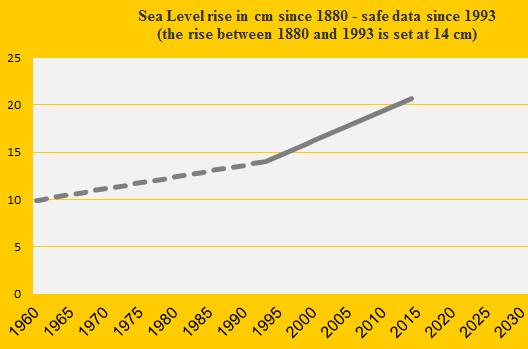
The estimated global Sea Level increase rate is unchanged 0.32 cm annually since 1993. The increase between 1880 and 1993 is set at 14.00 cm. This adds up to a total Sea Level rise from 1880 to 2014 at 20.72 cm – this figure is used in ClimatePositions.
See the development of Sea Level 1960-2014 in the diagram (the 1880-level is set at 0). The national climate debt in ClimatePositions increases along with the rising Sea Level. Here is one example: Indonesia’s climate debt increased from $61 per capita to $62 (or (or $237 million increase of the total Indonesian climate debt).
Data on global Sea Level: University of Colorado (links in the menu “Calculations”).
Comments are closed.