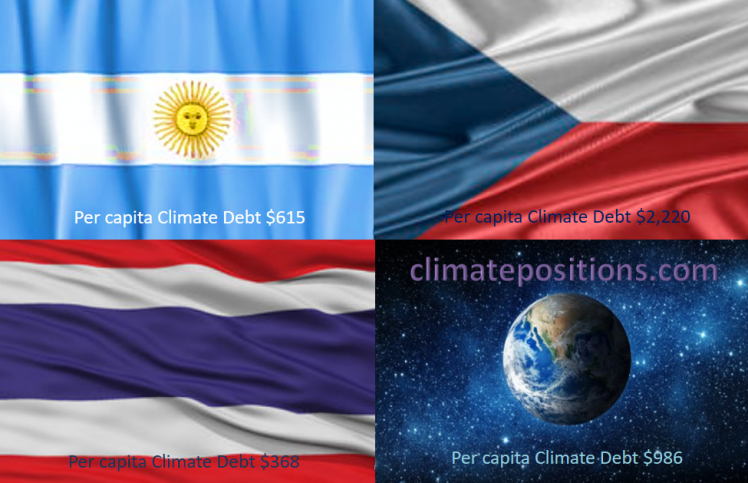
Share of global Climate Debt rank 31st, 32nd and 33rd: Argentina, Thailand and Czech Republic (combined responsible for 1.0% of Climate Debt and 1.6% of Fossil CO2 Emissions 2016)
2017
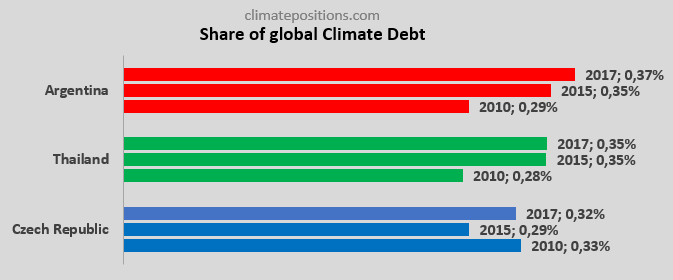
The diagram below shows ‘Share of global Climate Debt‘ in 2010, 2015 and 2017 of Argentina, Thailand and Czech Republic (ranked 31st, 32nd and 33rd). The share of Argentina is increasing while the share of Thailand has flattened out.
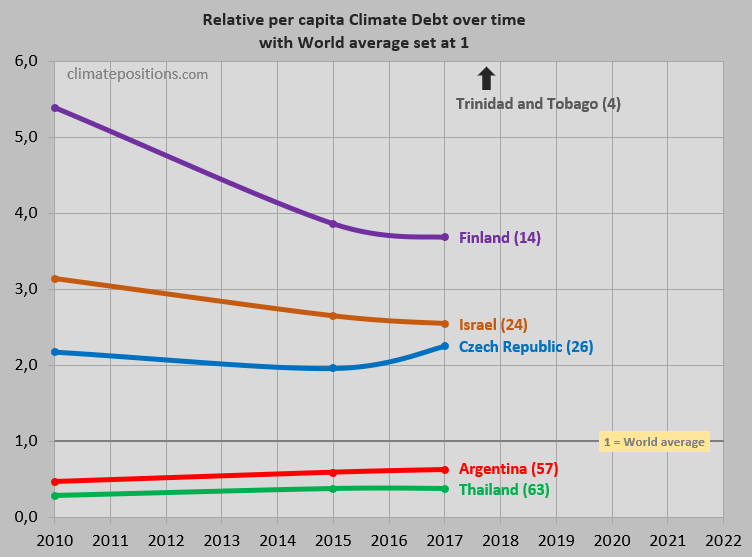
The following exposes the key-data in the Climate Debt calculations: Fossil CO2 Emissions, GDP, Environmental Performance, Ecological Footprint without carbon, Forest Cover, Primary Forests, Nuclear Power, Population trends and climate change financing. For comparison, Israel, Finland and Trinidad and Tobago (ranked 34th, 35th, and 36th in Share of global Climate Debt) are included in some diagrams.
The ‘Per capita Climate Debt‘ accumulated since 2000 of Argentina, Thailand and Czech Republic are $615, $368 and $2,220, respectively. The second diagram shows the trends between 2010 and 2017, with world average set at 100, for the three countries as well as of Israel, Finland and Trinidad and Tobago. The per capita Climate Debt ranking by October 2017 is shown in brackets.
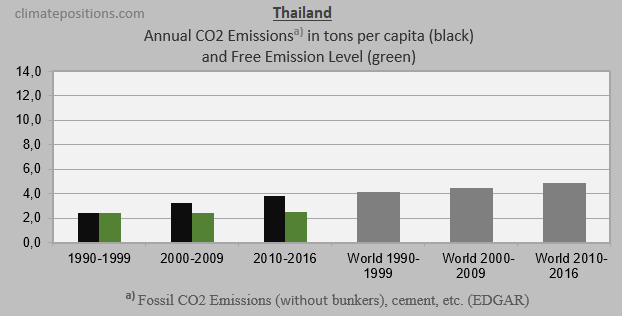
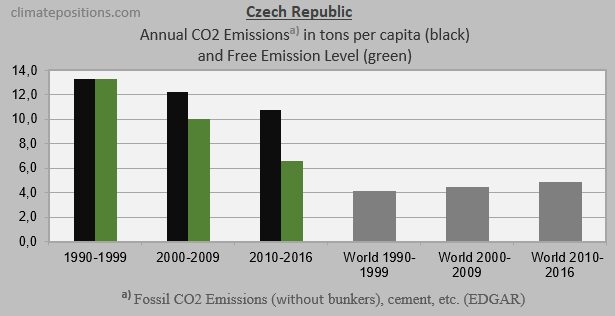
The next three diagrams show Fossil CO2 Emissions from fuels and industrial processes¹, in tons per capita in decades, of Argentina, Thailand and Czech Republic. The green bars show the Free Emission Level² – the exceedance is the basis for calculating the national Climate Debt. The grey bars are World emissions average.
CO2 Emissions data 1990-2016 (EDGAR) has been updated October 2017.
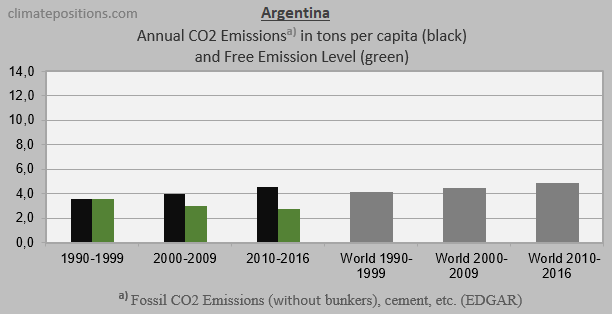
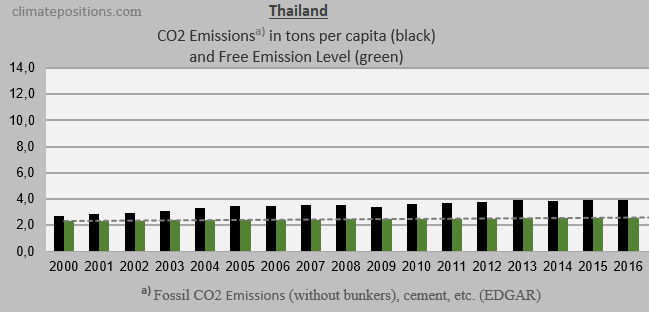
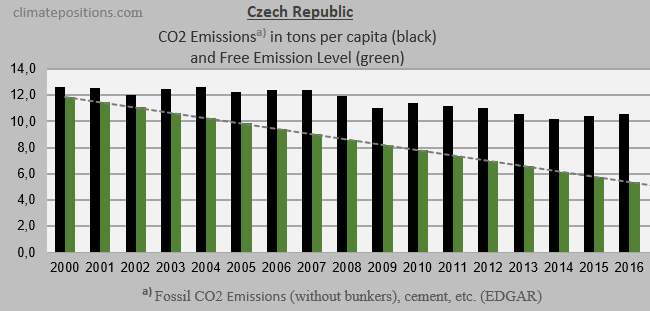
The three diagrams below show the per capita Fossil CO2 Emissions from fuels and industrial processes¹, annually since 2000, of the three countries. The green bars show the Free Emission Level². Argentina’s emissions have increased although they ought to decrease slightly, whereas the reductions of Czech Republic are inadequate.

The diagram below shows per capita GDP(ppp-$) of the six countries and the World average. The wealth of Czech Republic is more than twize the one of Thailand.

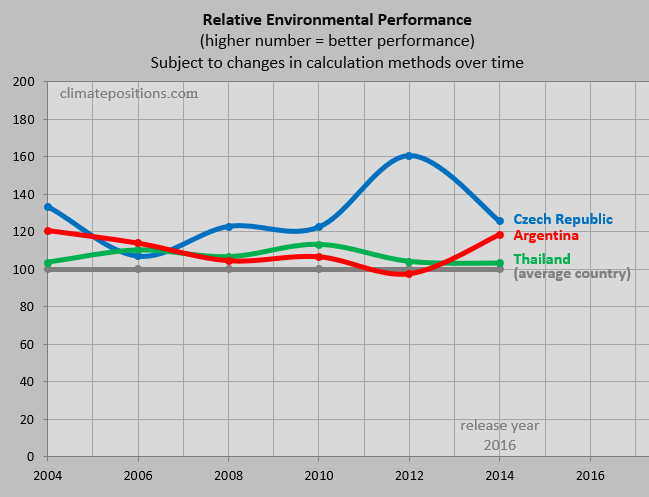
The next diagram shows the relative Environmental Performance of Argentina, Thailand and Czech Republic, with an average World country set at 100. [Added 25-1-2018: See the new ‘Environmental Performance Index 2018‘]
The average per capita Ecological Footprint without carbon, between 2000 and 2013, with an average World country set at 100, of Argentina, Thailand and Czech Republic are 169, 74 and 78, respectively. Release years are about four years after data years. Argentina’s Climate Debt would have been 2.3% smaller with World average footprint. Note that footprint calculation methods have changed over time. The latest and historic details from the source are available here: ‘Argentina‘, ‘Thailand‘ and ‘Czech Republic‘.
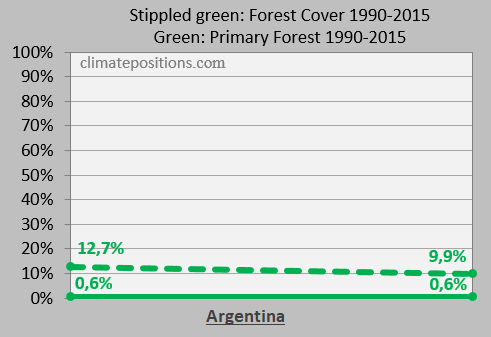
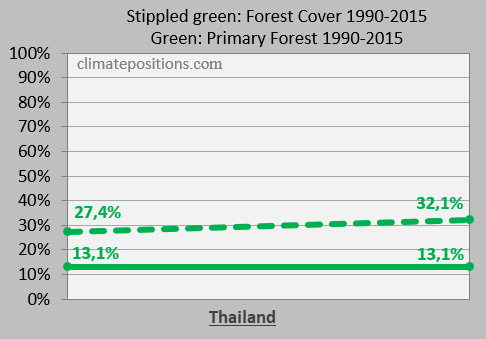
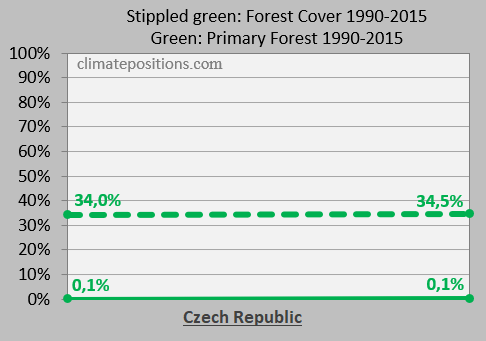
Forest Cover and the precious Primary Forests as percentage of total land area, in 1990 and 2015, are important indicators in ClimatePositions. Thailand’s Primary Forests cover 40.8% of the total Forest Cover, whereas Argentina and Czech Republic have insignificant Primary Forests.
The per capita Nuclear Power generation 2000-2016 is shown below (the per capita ranking is shown in brackets). Czech Republic now generate less Nuclear Power per capita than neighboring Slovakia. In the calculation of Climate Debt, Nuclear Power must be phased out similar to Fossil Fuels, calculated as if Nuclear Power was oil-generated.
![]()
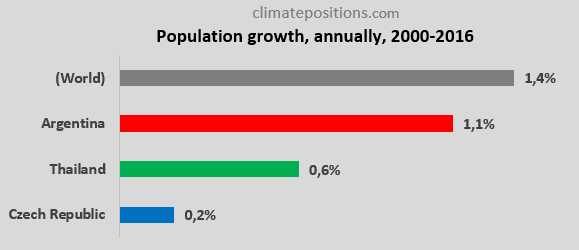
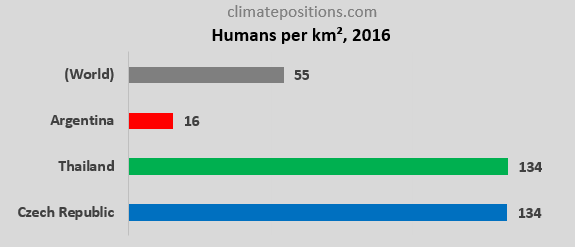
The diagrams below show Population density 2016 and growth between 2000 and 2016. The growth-rate of all three countries is below World average. The Populations of Argentina, Thailand and Czech Republic are about 44, 69 and 10.6 million, respectively.
Finally, the table below shows four key values of Argentina, Thailand, Czech Republic, Israel, Finland and Trinidad and Tobago in the calculation of national Climate Debts in ClimatePositions. The price of CO2 per ton (column two) is for total CO2 Emission from Fossil Fuels (without bunkers) and industrial processes. Climate change financing (column three) is from July 2017.
| . | Tons of CO2 | Price per | Climate change | Financing as |
| . | exceeded since | ton CO2 | financing | share of |
| . | 2000, per capita | since 2000 | per capita | Climate Debt |
| . | . | . | . | . |
| Argentina | 22.65 | $8.58 | $0.00 | 0.00% |
| Thailand | 17.56 | $6.23 | $0.00 | 0.00% |
| Czech Rep. | 51.22 | $11.23 | $1.14 | 0.05% |
| Israel | 53.19 | $15.96 | $0.00 | 0.00% |
| Finland | 67.03 | $19.64 | $38.58 | 1.01% |
| Trinidad and T. | 307.56 | $31.71 | $0.00 | 0.00% |
.
¹Fossil CO2 Emissions include all anthropogenic emissions from Fossil Fuel (combustion and production) and from industrial processes (cement, steel, liming, urea and ammonia production or consumption). The uncertainty in Fossil CO2 emissions is below 5% for industrialized countries and below 15% for developing countries.CO2 Emissions from international shipping and aviation (bunkers) are not included.
²The Free Emission Level (green bars) is determined by national CO2 Emissions 1990-1999 (base), and 11 more ‘Indicators‘, of which 7 are national and 4 are global.
.
Updated data and diagrams of all ‘Indicators‘ and all countries in ClimatePositions are available in the menu ‘Calculations (Excel)‘.
Data on Fossil CO2 Emissions (excluding international shipping and aviation) and industrial processes (cement, steel, liming, etc.) are from EDGAR (European Commission) (links in the menu Calculations / Sources & Links).
Information on national GDP(ppp-$) per capita: Worldbank (links in the menu Calculations / Sources & Links).
Source on Environmental Performance: Yale and Columbia University (links in the menu Calculations / Sources & Links).
Source on Ecological Footprint: Global Footprint Network (links in the menu Calculations / Sources & Links).
Data on national Forest Cover and Primary Forests are from United Nations UN (Report: Global Forest Resources Assessments) (links in the menu Calculations / Sources & Links).
Data on national Nuclear Power generation: World Nuclear Association (links in the menu Calculations / Sources & Links).
Data on national and global Populations is from Worldbank (links in the menu Calculations / Sources & Links).
PowerPoint collage with flags by Claus Andersen, 2017.
Comments are closed.