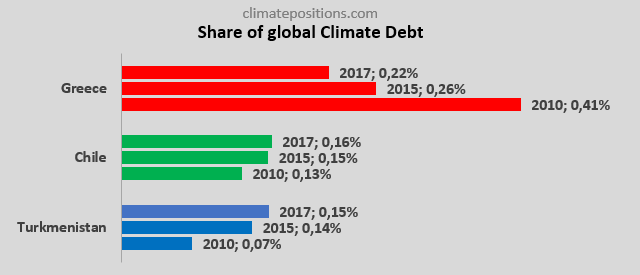
Share of global Climate Debt rank 40th, 41st and 42nd: Greece, Chile and Turkmenistan (combined responsible for 0.52% of Climate Debt and 0.64% of Fossil CO2 Emissions 2016)
2017
The diagram below shows ‘Share of global Climate Debt‘ in 2010, 2015 and 2017 of Greece, Chile and Turkmenistan (ranked 40th, 41st and 42nd). The share of Greece is decreasing, while the shares of Chile and Turkmenistan are increasing.
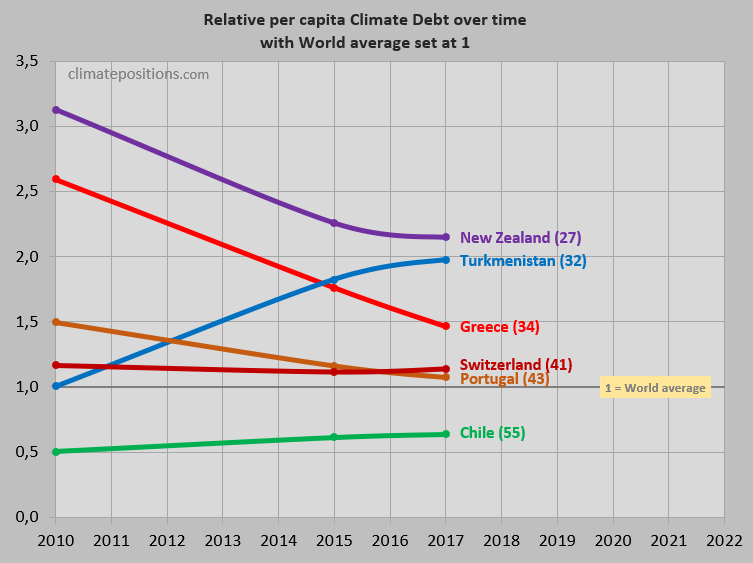
The following exposes the key-data in the Climate Debt calculations: Fossil CO2 Emissions, GDP, Environmental Performance, Ecological Footprint without carbon, Forest Cover, Primary Forests, Population trends and climate change financing. For comparison, Portugal, New Zealand and Switzerland (ranked 43rd, 44th and 45th in Share of global Climate Debt) are included in some diagrams.
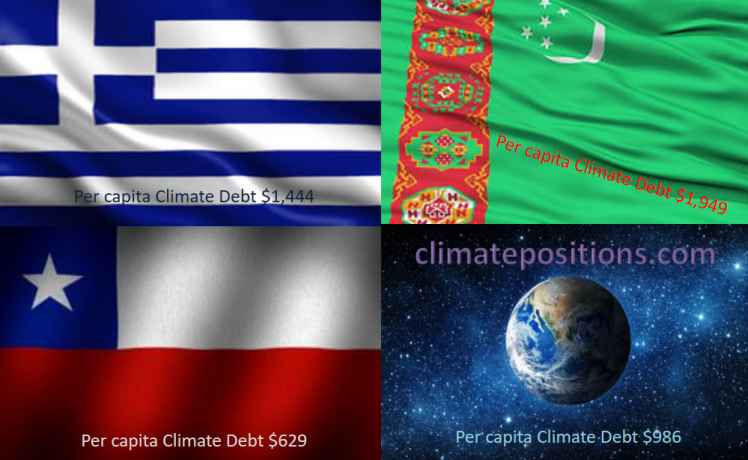
The ‘Per capita Climate Debt‘ accumulated since 2000 of Greece, Chile and Turkmenistan are $1,444, $629 and $1,949, respectively. The second diagram shows the trends between 2010 and 2017, with world average set at 100, for the three countries as well as of Portugal, New Zealand and Switzerland. The per capita Climate Debt ranking by October 2017 is shown in brackets.
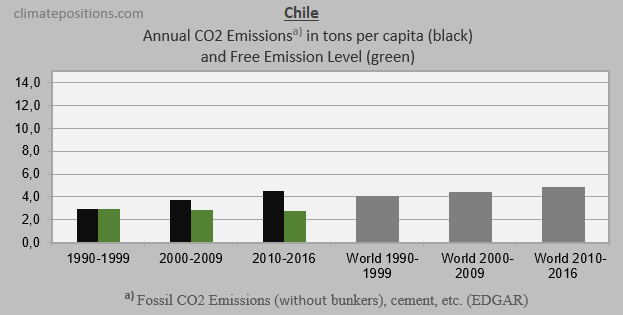
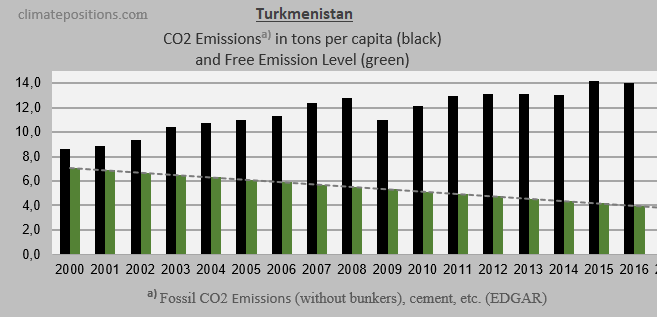
The next three diagrams show Fossil CO2 Emissions from fuels and industrial processes¹, in tons per capita in decades, of Greece, Chile and Turkmenistan. The green bars show the Free Emission Level² – the exceedance is the basis for calculating the national Climate Debt. The grey bars are World emissions average.
CO2 Emissions data 1990-2016 (EDGAR) has been updated October 2017.
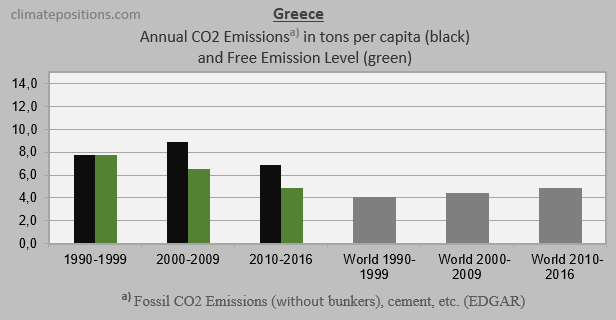
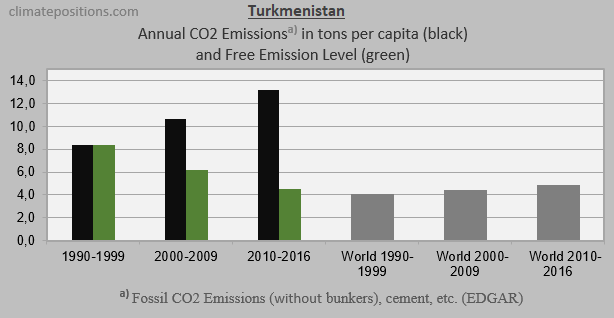
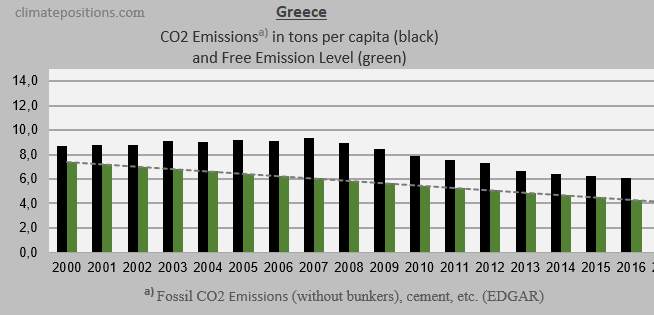
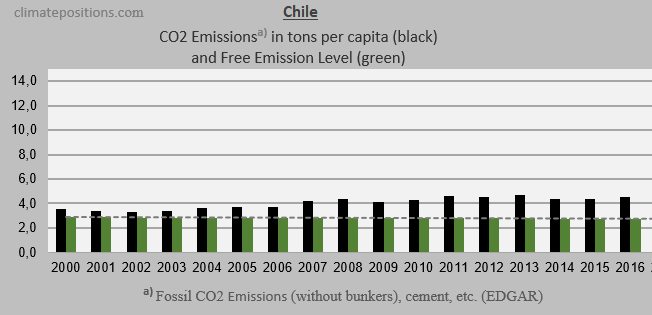
The three diagrams below show the per capita Fossil CO2 Emissions from fuels and industrial processes¹, annually since 2000, of the three countries. The green bars show the Free Emission Level². The reduction-rate of Greece is substantial since 2007, whereas Turkmenistan’s wild growing emissions are outrageous.
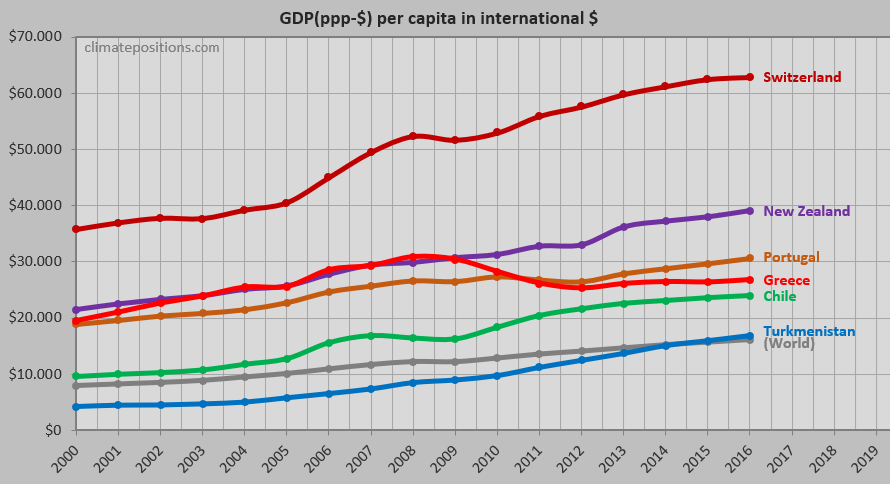
The diagram below shows per capita GDP(ppp-$) of the six countries and the World average. The wealth of Turkmenistan passed World average recently.
The next diagram shows the relative Environmental Performance of Greece, Chile and Turkmenistan, with an average World country set at 100. As for GDP, Turkmenistan passed World average recently. [Added 25-1-2018: See the new ‘Environmental Performance Index 2018‘]

The average per capita Ecological Footprint without carbon, between 2000 and 2013, with an average World country set at 100, of Greece, Chile and Turkmenistan are 144, 150 and 94, respectively. Release years are about four years after data years. Chile’s Climate Debt would have been 3.1% smaller with World average footprint. Note that footprint calculation methods have changed over time. The latest and historic details from the source are available here: ‘Greece‘ and ‘Chile‘ (data on Turkmenistan is missing at the site).
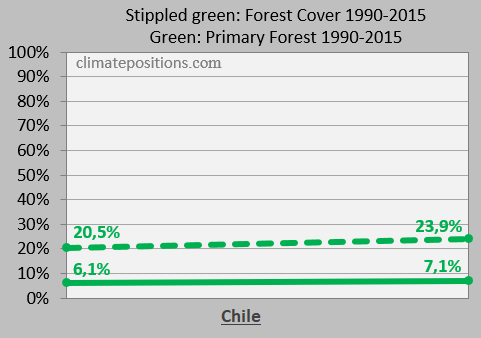
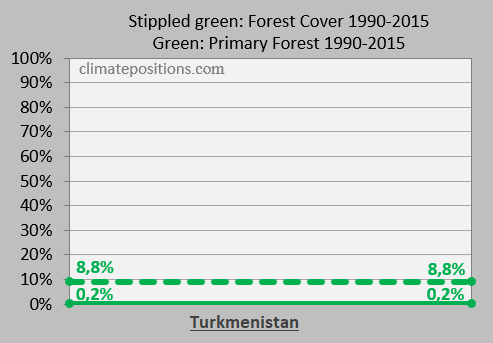
Forest Cover and the precious Primary Forests as percentage of total land area, in 1990 and 2015, are important indicators in ClimatePositions. Turkmenistan has small and unchanged indicator values, while Chile’s grew slightly. The Greek Forest Cover grew by 5.9% of total land area (reducing the accumulated Climate Debt by 15.7%) while its Primary Forests are still zero.

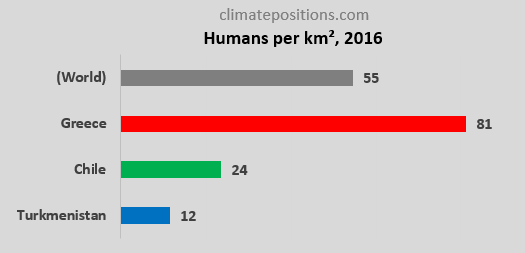
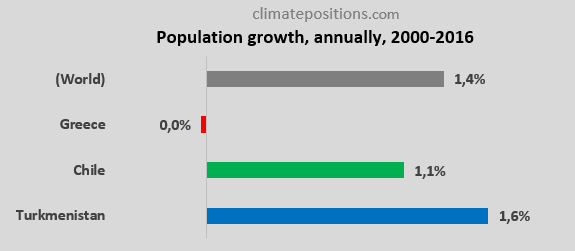
The diagrams below show Population density 2016 and growth between 2000 and 2016. The Greek Population declined slightly. The Populations of Greece, Chile and Turkmenistan are about 10.7, 18 and 5.7 million, respectively.
Finally, the table below shows four key values of Greece, Chile, Turkmenistan, Portugal, New Zealand and Switzerland in the calculation of national Climate Debts in ClimatePositions. The price of CO2 per ton (column two) is for total CO2 Emission from Fossil Fuels (without bunkers) and industrial processes. Climate change financing (column three) is from July 2017.
| . | Tons of CO2 | Price per | Climate change | Financing as |
| . | exceeded since | ton CO2 | financing | share of |
| . | 2000, per capita | since 2000 | per capita | Climate Debt |
| . | . | . | . | . |
| Greece | 38.00 | $10.55 | $0.37 | 0.03% |
| Chile | 21.09 | $9.24 | $0.00 | 0.00% |
| Turkmenistan | 105.2 | $9.80 | $0.00 | 0.00% |
| Portugal | 26.67 | $11.52 | $0.77 | 0.07% |
| New Zealand | 44.82 | $16.02 | $2.98 | 0.13% |
| Switzerland | 14.04 | $11.69 | $33.32 | 2.97% |
.
¹Fossil CO2 Emissions include all anthropogenic emissions from Fossil Fuel (combustion and production) and from industrial processes (cement, steel, liming, urea and ammonia production or consumption). The uncertainty in Fossil CO2 Emissions is below 5% for industrialized countries and below 15% for developing countries. CO2 Emissions from international shipping and aviation (bunkers) are not included.
²The Free Emission Level (green bars) is determined by national Fossil CO2 Emissions 1990-1999 (base), and 11 more ‘Indicators‘, of which 7 are national and 4 are global.
.
Updated data and diagrams of all ‘Indicators‘ and all countries in ClimatePositions are available in the menu ‘Calculations (Excel)‘.
Data on Fossil CO2 Emissions (excluding international shipping and aviation) and industrial processes (cement, steel, liming, etc.) are from EDGAR (European Commission) (links in the menu Calculations / Sources & Links).
Information on national GDP(ppp-$) per capita: Worldbank (links in the menu Calculations / Sources & Links).
Source on Environmental Performance: Yale and Columbia University (links in the menu Calculations / Sources & Links).
Source on Ecological Footprint: Global Footprint Network (links in the menu Calculations / Sources & Links).
Data on national Forest Cover and Primary Forests are from United Nations UN (Report: Global Forest Resources Assessments) (links in the menu Calculations / Sources & Links).
Data on national Nuclear Power generation: World Nuclear Association (links in the menu Calculations / Sources & Links).
Data on national and global Populations is from Worldbank (links in the menu Calculations / Sources & Links).
PowerPoint collage with flags by Claus Andersen, 2017.
Comments are closed.