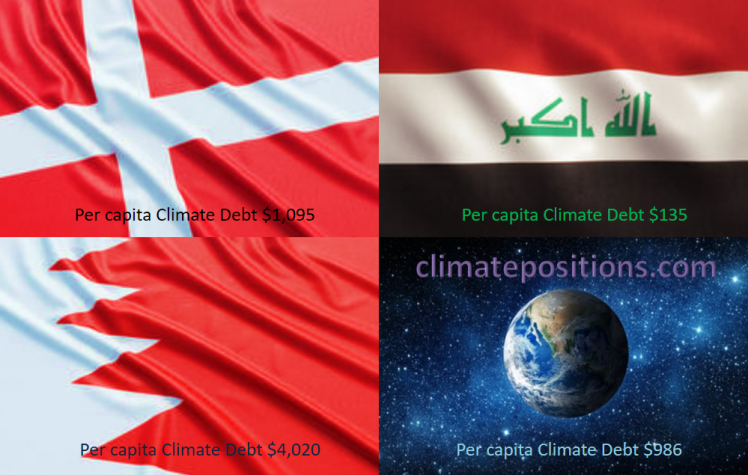
Share of global Climate Debt rank 52nd, 53rd and 54th: Denmark, Bahrain and Iraq (combined responsible for 0.24% of Climate Debt and 0.63% of Fossil CO2 Emissions 2016)
2018
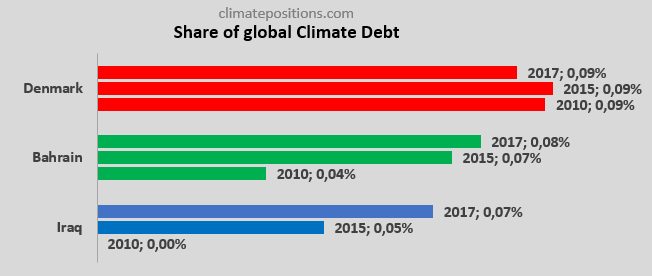
The diagram below shows ‘Share of global Climate Debt‘ in 2010, 2015 and 2017 of Denmark, Bahrain and Iraq (ranked 52nd, 53rd and 54th). The shares of Bahrain and Iraq have increased significantly (Iraq had no Climate Debt in 2010), whereas Denmark’s share is relatively stable.
The following exposes the key-data in the Climate Debt calculations: Fossil CO2 Emissions, GDP, Environmental Performance, Ecological Footprint without carbon, Forest Cover, Primary Forests, Population trends and climate change financing. For comparison, Hungary, Slovakia and Serbia (ranked 55th, 56th and 57th in Share of global Climate Debt) are included in some diagrams.
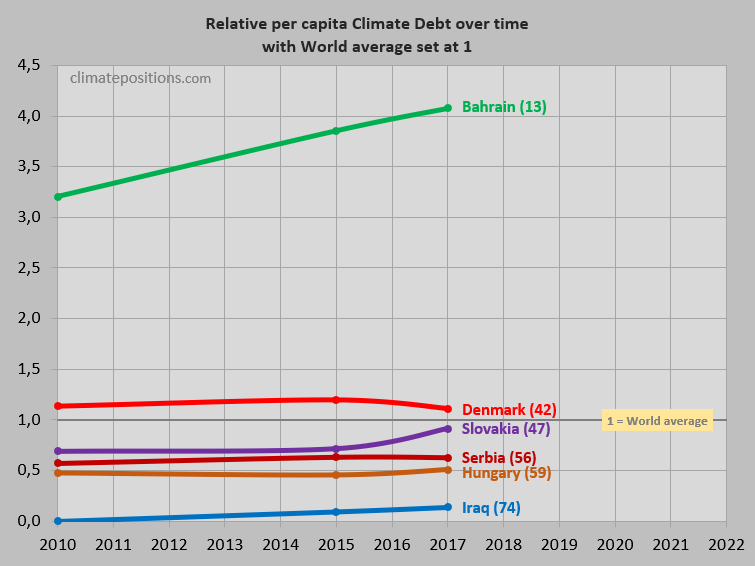
The ‘Per capita Climate Debt‘ accumulated since 2000 of Denmark, Bahrain and Iraq are $1,095, $4,020 and $135, respectively. The second diagram shows the trends between 2010 and 2017, with world average set at 100, for the three countries as well as of Hungary, Slovakia and Serbia. The per capita Climate Debt ranking by October 2017 is shown in brackets.
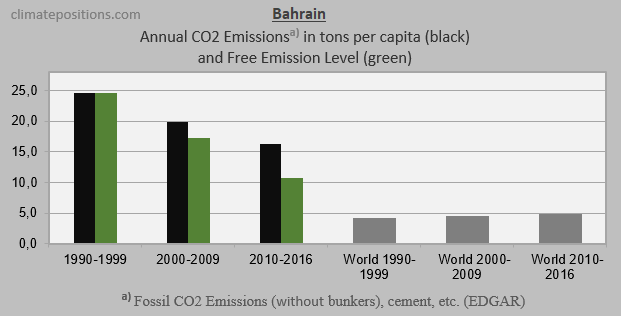
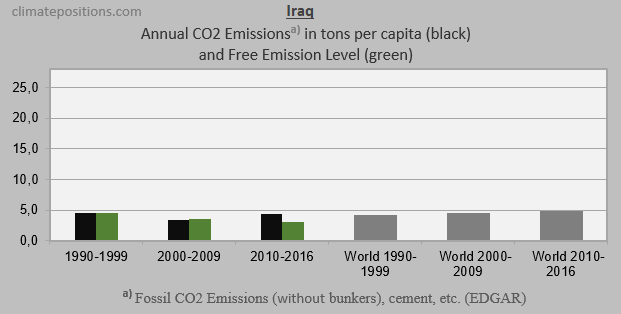
The next three diagrams show Fossil CO2 Emissions from fuels and industrial processes¹, in tons per capita in decades, of Denmark, Bahrain and Iraq. The green bars show the Free Emission Level² – the exceedance is the basis for calculating the national Climate Debt. The grey bars are World emissions average.
CO2 Emissions data 1990-2016 (EDGAR) has been updated October 2017.
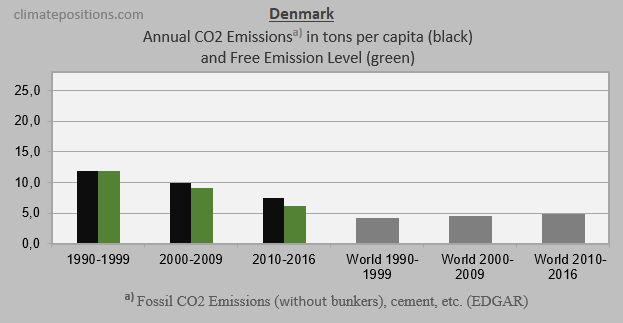
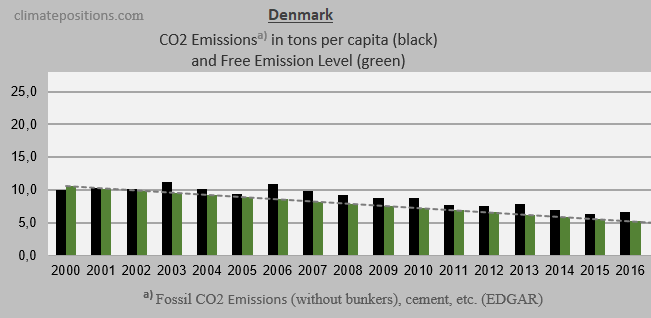
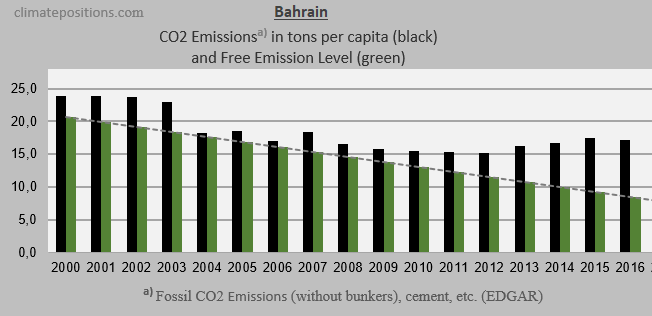
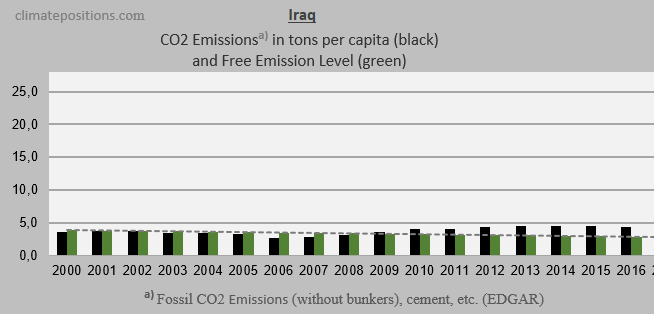
The three diagrams below show the per capita Fossil CO2 Emissions from fuels and industrial processes¹, annually since 2000, of the three countries. The green bars show the Free Emission Level². The Danish reduction-rate is substantial, although insufficient. Bahrain’s per capita emissions decrease is strongly linked to the extreme Population growth as a result of relatively low-emitting immigrant workers, whereas Iraq’s emissions has been too high since 2009.
The diagram below shows per capita GDP(ppp-$) of the six countries and the World average. The wealth of Denmark is 3.1 times greater than World average.

The next diagram shows the relative Environmental Performance of Denmark, Bahrain and Iraq, with an average World country set at 100. Relatively, both Bahrain and Iraq have improved significantly since 2008. [Added 25-1-2018: See the new ‘Environmental Performance Index 2018‘]

The average per capita Ecological Footprint without carbon, between 2000 and 2013, with an average World country set at 100, of Denmark, Bahrain and Iraq are 278, 98 and 29, respectively. Denmark has the highest average footprint in the World during this period, and the Climate Debt of Denmark would have been 40.8% smaller with World average footprint. Release years are about four years after data years. Note that footprint calculation methods have changed over time. See the latest and historic details from the source of ‘Denmark‘ (data of Bahrain and Iraq are missing at the site).
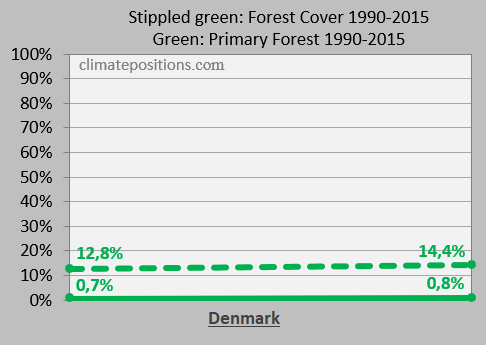
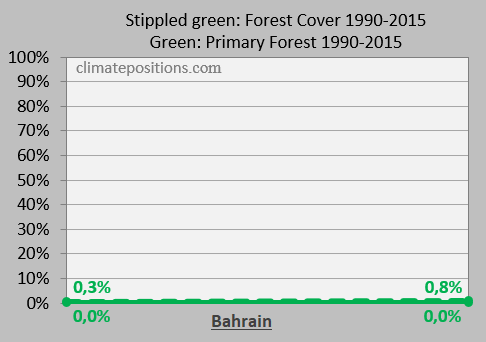
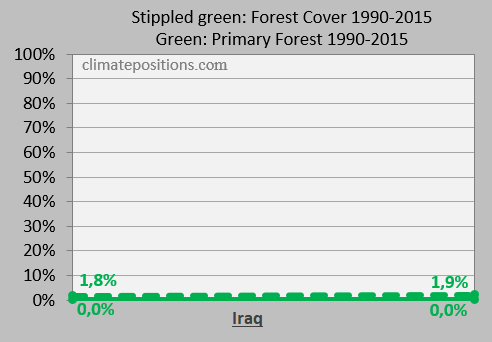
Forest Cover and the precious Primary Forests as percentage of total land area, in 1990 and 2015, are important indicators in ClimatePositions. Denmark’s have increased Forest Cover somewhat, while Primary Forests are roughly stable. Bahrain and Iraq have both increased Forest Cover, however, from a very low starting point.
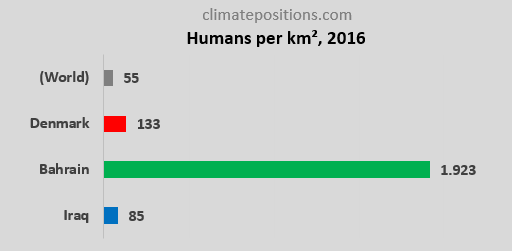
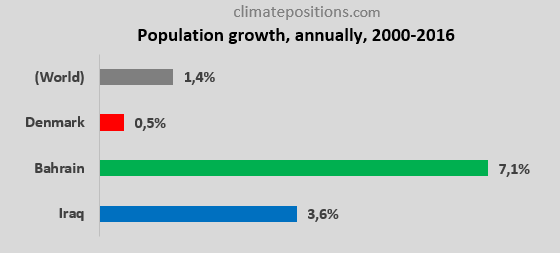
The diagrams below show Population density 2016 and growth between 2000 and 2016. Bahrain’s Population density is 4th highest in the World (after Macao, Singapore and Hong Kong) and in addition the Population growth since 2000 is also 4th highest (after Qatar, United Arab Emirates and Equatorial Guinea). The Populations of Denmark, Bahrain and Iraq are about 5.7, 1.4 and 37 million, respectively.
Finally, the table below shows four key values of Denmark, Bahrain, Iraq, Hungary, Slovakia and Serbia in the calculation of national Climate Debts in ClimatePositions. The price of CO2 per ton (column two) is for total CO2 Emission from Fossil Fuels (without bunkers) and industrial processes. Climate change financing (column three) is from July 2017.
| . | Tons of CO2 | Price per | Climate change | Financing as |
| . | exceeded since | ton CO2 | financing | share of |
| . | 2000, per capita | since 2000 | per capita | Climate Debt |
| . | . | . | . | . |
| Denmark | 17.6 | $7.54 | $44.84 | 4.09% |
| Bahrain | 64.73 | $13.11 | $0.00 | 0.00% |
| Iraq | 6.46 | $2.13 | $0.00 | 0.00% |
| Hungary | 14.84 | $5.42 | $0.61 | 0.12% |
| Slovakia | 23.51 | $7.12 | $0.00 | 0.00% |
| Serbia | 33.31 | $5.99 | $0.00 | 0.00% |
.
¹Fossil CO2 Emissions include all anthropogenic emissions from Fossil Fuel (combustion and production) and from industrial processes (cement, steel, liming, urea and ammonia production or consumption). The uncertainty in Fossil CO2 emissions is below 5% for industrialized countries and below 15% for developing countries.CO2 Emissions from international shipping and aviation (bunkers) are not included.
²The Free Emission Level (green bars) is determined by national CO2 Emissions 1990-1999 (base), and 11 more ‘Indicators‘, of which 7 are national and 4 are global.
.
Updated data and diagrams of all ‘Indicators‘ and all countries in ClimatePositions are available in the menu ‘Calculations (Excel)‘.
Data on Fossil CO2 Emissions (excluding international shipping and aviation) and industrial processes (cement, steel, liming, etc.) are from EDGAR (European Commission) (links in the menu Calculations / Sources & Links).
Information on national GDP(ppp-$) per capita: Worldbank (links in the menu Calculations / Sources & Links).
Source on Environmental Performance: Yale and Columbia University (links in the menu Calculations / Sources & Links).
Source on Ecological Footprint: Global Footprint Network (links in the menu Calculations / Sources & Links).
Data on national Forest Cover and Primary Forests are from United Nations UN (Report: Global Forest Resources Assessments) (links in the menu Calculations / Sources & Links).
Data on national Nuclear Power generation: World Nuclear Association (links in the menu Calculations / Sources & Links).
Data on national and global Populations is from Worldbank (links in the menu Calculations / Sources & Links).
PowerPoint collage with flags by Claus Andersen, 2018.
Comments are closed.