South Korea is going backwards in climate performance
2013
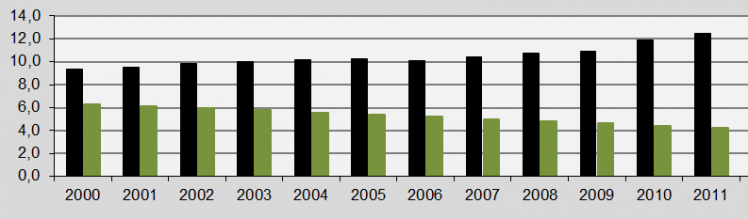
South Korea was the 15th worst performing country out of 145 in ClimatePositions 2010 with a Climate Contribution (climate debt) of $1,904 per capita. As shown in the front diagram the South Korean annual CO2 Emissions (carbon dioxide) have continued to increase in 2011 (12.5 tons per capita) and today the Contribution is $2,297 per capita. The updated calculations for all 145 countries are available in the submenu “Calculations (Excel)”.
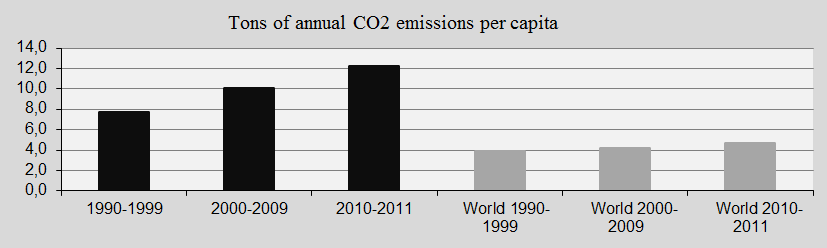
As shown in the diagram below the South Korean CO2 Emissions per capita has increased considerably since the 1990s (the black bars). In 2010-2011 the CO2 Emission level was more than three times the global average.
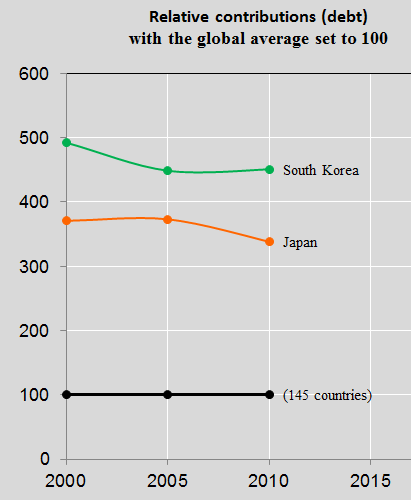
Most rich countries with large CO2 Emissions have a declining share of the global Climate Contribution due to emerging economies’ increasing Contributions (especially China) – but not South Korea. The diagram below illustrates this by comparing South Korea and Japan’s relative Contributions in 2000, 2005 and 2010 with the world average set at 0.
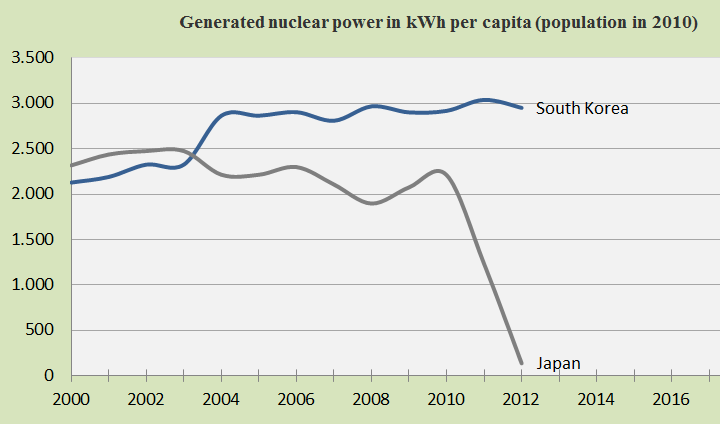
When it comes to generated Nuclear Power per capita South Korea and Japan are moving in opposite directions – see the diagram below. Had South Korea maintained the 2000 Nuclear Power level until today the saving would have been 5.2 billion US$.
Source on CO2 emissions: EIA, U.S. Energy Information Administration (links in the menu “Calculations”).
Data on national nuclear power generation is from: World Nuclear Association (links in the menu “Calculations”).
Comments are closed.