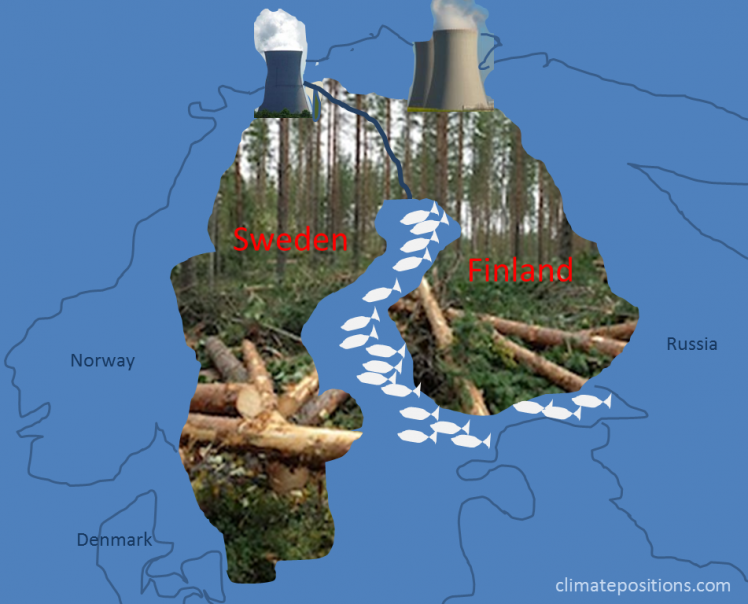
Sweden beats Finland in climate change performance
2015
Finland’s updated Climate Debt is $2,624 per capita and Sweden’s is $1,003. The ‘2014-rankings’ were 18th and 37th among 147 countries. The following examines the indicators of CO2 Emissions from fossil fuels, Nuclear Power, GDP(ppp-$), Climate Debt as a percentage of GDP(ppp-$) and Forest Cover.
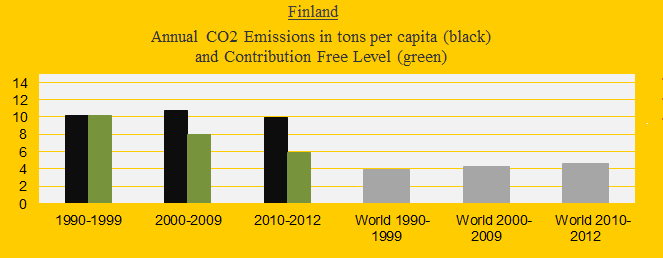
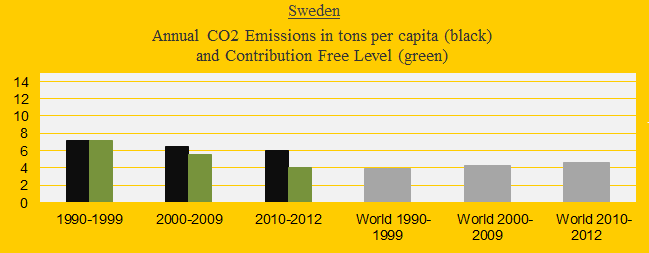
The two diagrams below show the CO2 Emissions per capita in decades of Finland and Sweden in comparison with the world average (the grey bars). The green bars show the Contribution Free Level in ClimatePositions – the free level is determined by CO2 Emissions in 1990s and a number of continuously updated ‘indicators’.
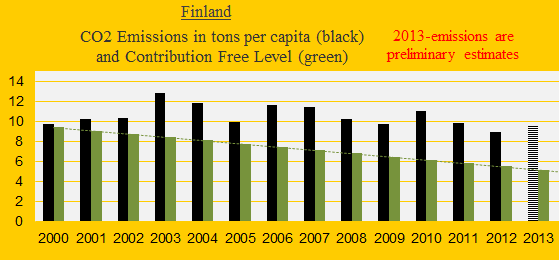
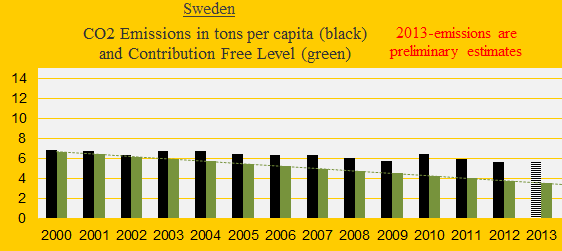
The next two diagrams show the CO2 Emissions per capita 2000-2013 (2013-emissions are preliminary estimates). The total amounts of CO2 Emissions exceeded per capita since 2000 are: Finland 44.9 tons and Sweden 16.4 tons. The exceeded emissions are the basis of the calculation of national Climate Debt.
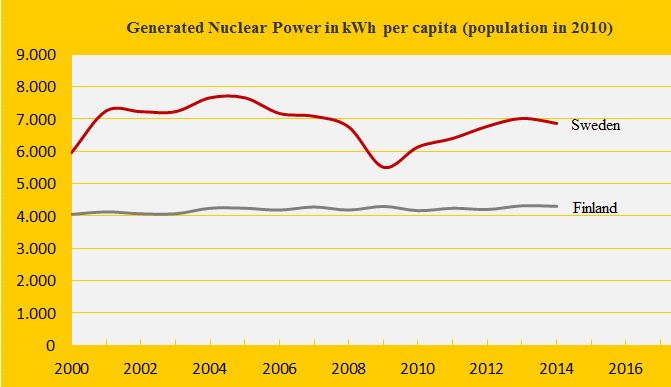
Sweden is the world’s largest per capita Nuclear Power generator and Finland is 3rd. The diagram below shows the per capita generation since 2000. In ClimatePositions Nuclear Power generation must be reduced at the same rate as CO2 Emissions from fossil fuels, because large quantities of dangerous radioactive nuclear waste are left for hundreds of generations to deal with in the future.
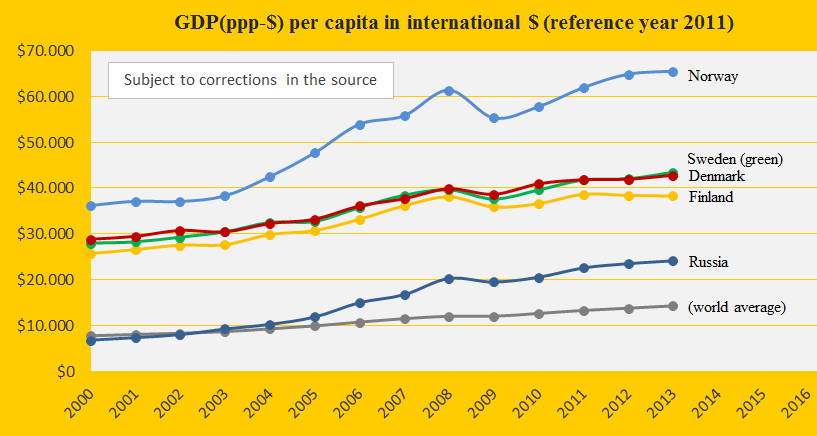
The GDP(ppp-$) per capita since 2000 of Finland, Sweden, Norway, Denmark, Russia and the world average, is shown in the diagram below. The superior Norwegian wealth is due to its large oil production.
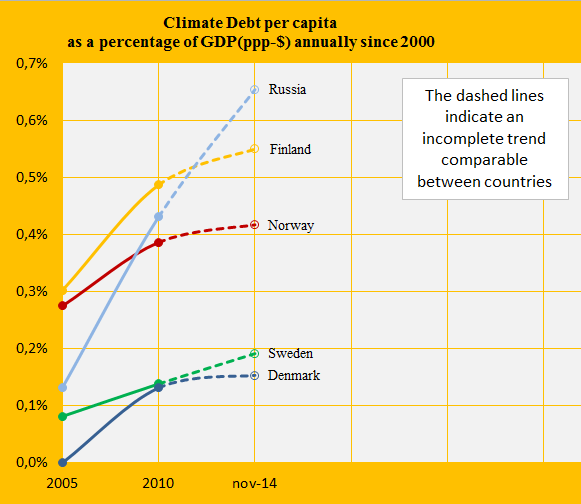
The Climate Debt calculated as percentages of the GDP(ppp-$) annually since 2000, of the same five countries, are shown in the diagram below. Calculated this way, Finland is the worst performing country among the Scandinavian countries. The performance of Putin’ Russia speaks for itself. See the ‘ranking’.
Among the 82 countries with Climate Debt in ClimatePositions, Finland has the largest proportion of Forest Cover (72.9% of the land area in 2010) and Sweden has the second largest proportion (68.7%). However, Finland has none of the precious Primary Forests and Sweden has only 4.9% of the land area (or 7.1% of the Forest Cover). Both Scandinavian countries have increases Forest Cover slightly since 1990 (however, only the change matters in the calculation of Climate Debt)..
.
Source on CO2 Emissions: EIA, U.S. Energy Information Administration and data on preliminary national CO2 Emissions are from Global Carbon Project (links in the menu “Calculations”).
Information on national GDP(ppp-$) per capita: Worldbank (links in the menu “Calculations”).
Data on national Nuclear Power generation: World Nuclear Association (links in the menu “Calculations”).
Sources on national forest cover and primary forests: United Nations (UN) (links in the menu “Calculations”).
Sources on national marine protections: United Nations (UN) (links in the menu “Calculations”).
Collage by Claus Andersen, 2015.
Comments are closed.