CO2 reduction targets worldwide
2014
Countless proposals have been launched during the years for the required reductions in CO2 Emissions. However, most of the suggested reduction targets have been empty statements and the overall scientific recommendations¹ are persistently being ignored by those in power. Meanwhile the global CO2 Emissions continue to increase (by 52% since 1990) and the worst case climate scenario is now unfolding.
In ClimatePositions the method of calculating the CO2 targets is identical for all countries. The different outcome is entirely due to varying national and global indicator values (read ‘more‘) and the auto-calculation of the Climate Contributions are based on the exceeded national CO2 Emissions since 2000. The indicator values are continuously updated and entered in a ‘spreadsheet’. The following examines the CO2 Emission targets of four country groups (each group is analyzed as if it was one large country¹): 1) All 145 countries with full data, 2) The 80 countries with Climate Contribution (climate debt) 3) The 20 countries with the largest Climate Contribution per capita and 4) The 65 Contribution Free countries.
Note that the figures in this post are estimates designed to show the overall picture (ClimatePosition is aimed at countries, not groups of countries).
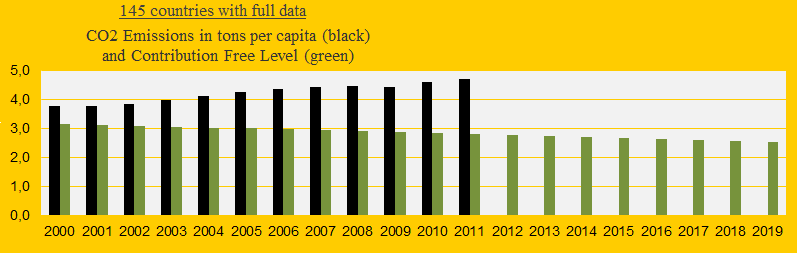
1) All 145 countries with full data represent 96% of the global population. In 1990-1999 the average CO2 Emissions were approximately² 3.6 tons per capita and the average present reduction target in 2019 is 2.5 tons. The diagram below shows the average CO2 Emissions 2000-2011 (the black bars) and the average Contribution Free level (the green bars). The required average CO2 reduction is 30% and the price per ton CO2 emitted until 2011 is $4.82.
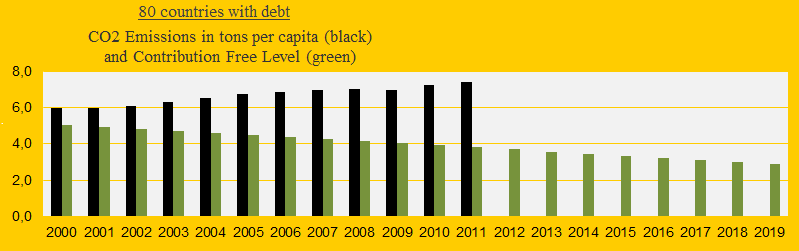
2) The 80 countries with Climate Contribution (climate debt) represent 55% of the global population. In 1990-1999 the average CO2 Emissions were approximately² 5.7 tons per capita and the average reduction target in 2019 is 2.9 tons per capita. The diagram below shows the average CO2 Emissions 2000-2011 (the black bars) and the average Contribution Free level (the green bars). The required average CO2 reduction is 50% and the contribution cost per ton CO2 emitted until 2011 is $8.48.
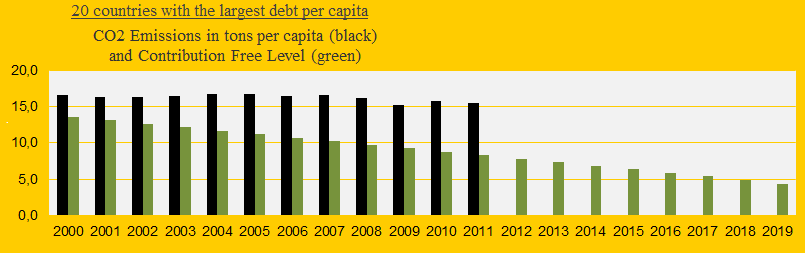
3) The 20 countries with the largest Climate Contribution (climate debt) per capita represent 9% of the global population. In 1990-1999 the average CO2 Emissions were approximately² 15.8 tons per capita and the average reduction target in 2019 is 4.4 tons. The diagram below shows the average CO2 Emissions 2000-2011 (the black bars) and the average Contribution Free level (the green bars). The required average CO2 reduction is 72% and the price per ton CO2 emitted until 2011 is $20.73.
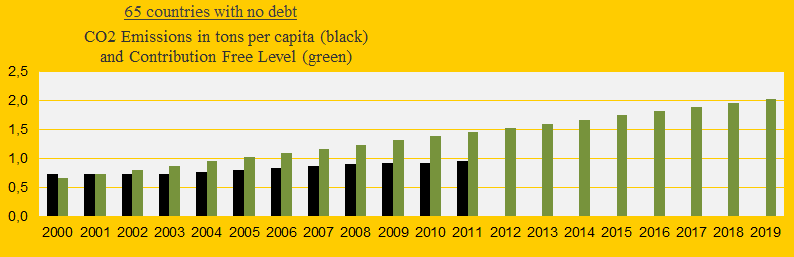
4) The 65 Contribution Free countries represent 40% of the global population. From 1990-1999 the average CO2 Emissions was approximately² 0.7 tons per capita and the average target for 2019 is 2.0 tons. For most countries in this group there is widespread poverty, and it is pointless to talk about CO2 reductions. The diagram below shows the average CO2 Emissions 2000-2011 (the black bars) and the average Contribution Free level (the green bars). Note that only a fraction of the unused CO2 allowances will be transferred to the next 20-year period starting 2020.
.
¹ The recent ‘press release’ from the ‘Intergovernmental Panel on Climate Change (IPCC)‘ says: “Scenarios show that to have a likely chance of limiting the increase in global mean temperature to two degrees Celsius, means lowering global greenhouse gas emissions by 40 to 70 percent compared with 2010 by mid-century, and to near-zero by the end of this century. Ambitious mitigation may even require removing carbon dioxide from the atmosphere.”
² The average CO2 Emissions per capita of the country groups are inaccurate since changes in the national populations are not taken into account in this particular calculation.
.
Source on CO2 Emissions: EIA, U.S. Energy Information Administration (links in the menu “Calculations”).
Comments are closed.