Top five in Climate Debt: Qatar, Kuwait, Singapore, United Arab Emirates and Trinidad and Tobago
2015
The updated Climate Debt per capita accumulated since 2000 of the five worst performing countries are:
- Qatar $35,565
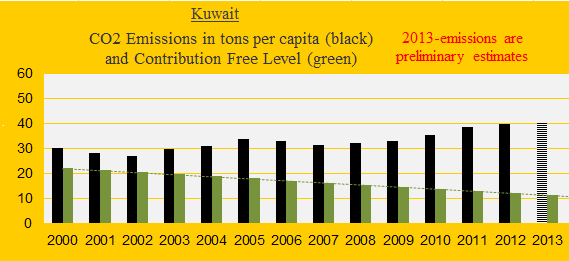
- Kuwait $31,828
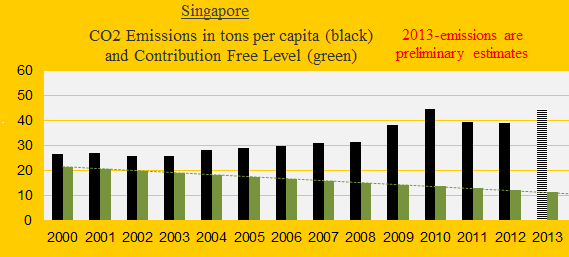
- Singapore $24,828
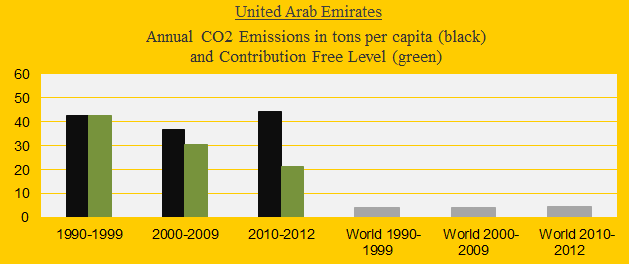
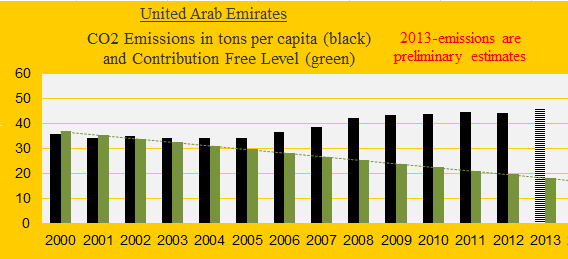
- United Arab Emirates $18,386
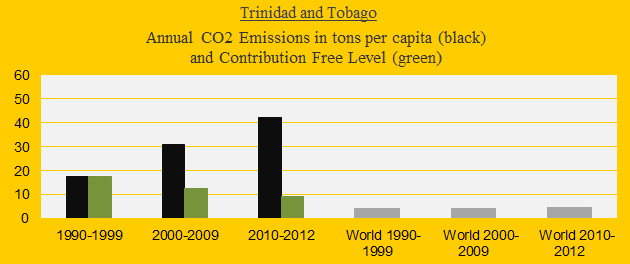
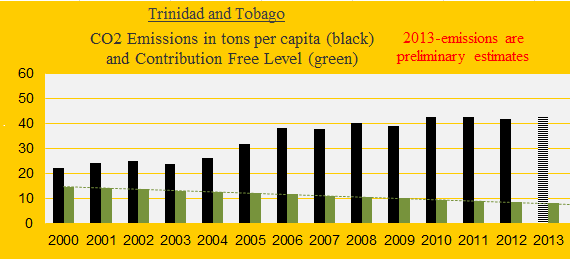
- Trinidad and Tobago $14,131
See the ‘ranking’ of 147 countries. The total population of the five small countries is 0.24% of the global population but the total Climate Debt is overwhelmingly 7.44% of the global Climate Debt (in 2012). The following analyses the indicators of GDP(ppp-$) and CO2 Emissions from fossil fuels (read about the issues of marine bunkers e.g. in Singapore at the bottom).
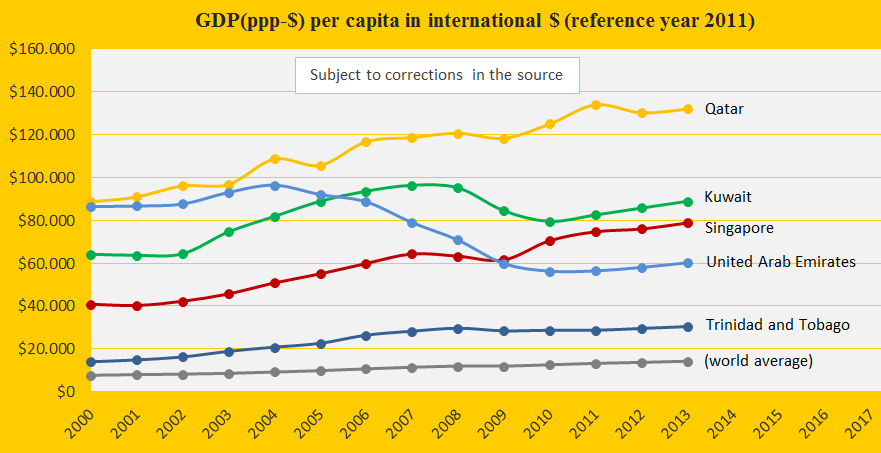
The GDP(ppp-$) per capita since 2000 of the five countries, and the world average, is shown in the diagram below. Trinidad and Tobago stands out among these by being only the 38th wealthiest country in the world; the others are ranked 1st, 4th, 5th and 8th. Note that none of the five countries have contributed with any ‘climate financing’ to developing countries.
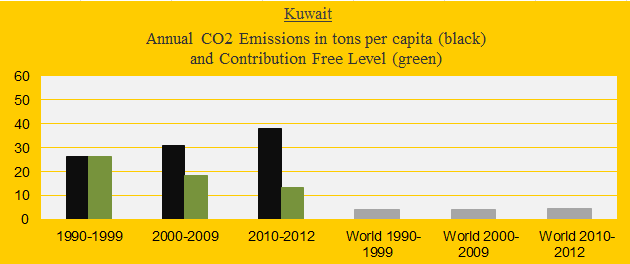
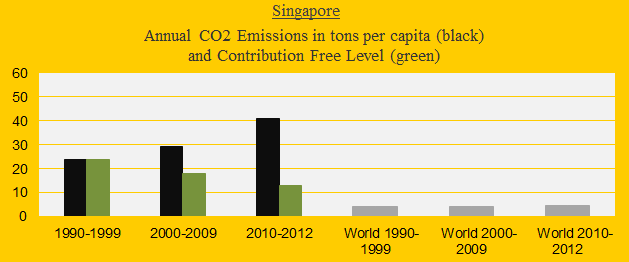
The five diagrams below show the CO2 Emissions per capita in decades of Qatar, Kuwait, Singapore, United Arab Emirates and Trinidad and Tobago, in comparison with the world average (the grey bars). The green bars show the Contribution Free Level in ClimatePositions – the free level is determined by CO2 Emissions in 1990s and a number of updated ‘indicators’. Qatar had the world’s largest per capita emissions in 2012 (among the full data countries in ClimatePositions).

The next five diagrams show the CO2 Emissions per capita 2000-2013 (2013-emissions are preliminary estimates) – the general picture is shocking cynicism towards future generations on the planet. The total amounts of CO2 Emissions exceeded per capita since 2000 is the basis of the calculation of the national Climate Debt.

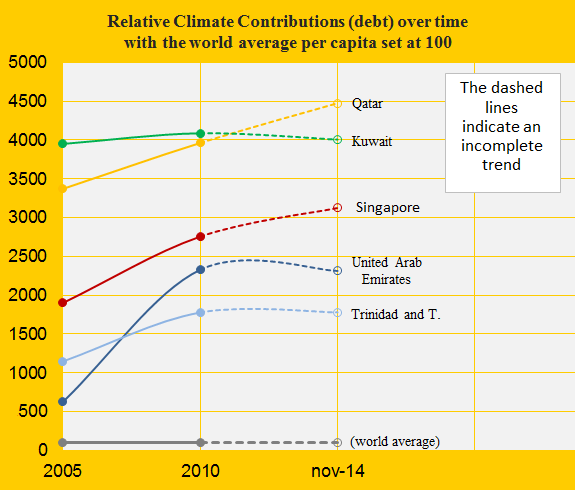
The diagram below shows the relative Climate Debt per capita since 2005, with the world average set at 100. Qatar’s Climate Debt passed the one of Kuwait around 2011.
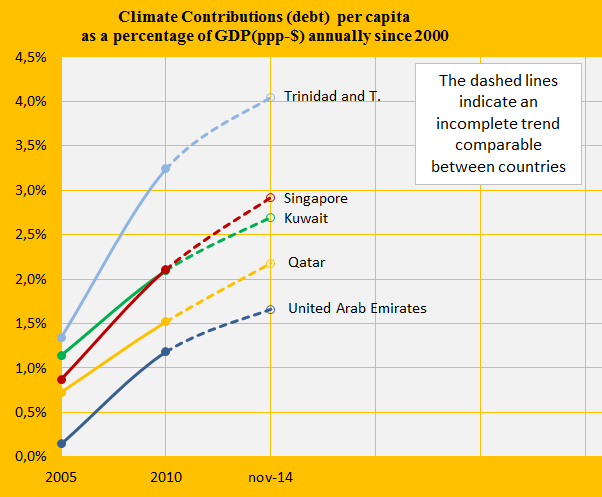
The Climate Debt calculated as percentages of the GDP(ppp-$) annually since 2000 are shown in the diagram below. Using this methodology, Trinidad and Tobago is a sovereign no. 1 among 147 countries (see the ‘ranking’).
Among the countless dilemmas² in the compilation of national greenhouse gas emissions (causing climate change) are the marine bunkers – deliveries of oils to ships for consumption during international voyages. ‘EIA’ include marine bunkers in its calculation of national energy consumption and corresponding CO2 Emissions from fossil fuels, while ‘IEA’ does not. Since the port of Singapore is no. 1 marine bunkering center in the world (responsible for 21% of all CO2 Emissions from marine bunkers globally¹ in 2011) the various methods of calculation makes a big difference: In 2011 the CO2 Emissions per capita of Singapore, from EIA and IEA, were respectively 39.2 tons (23.3 tons in 1995) and 12.5 tons (11.8 tons in 1995). If IEA’s data were to be used in ClimatePositions instead of EIA’s Singapore’s Climate Debt ranking would drop from 3rd to around 9th (a drop second to none due to Singapore’s unique position). However, here are some counter arguments to consider:
- The marine bunkers of Singapore are integrated in the national oil industry with refining, trading, equipment manufacturing, jack-up rigs, floating offloading units, chemical industry etc. The revenue from bunkers (causing large CO2 Emissions at sea) is thus part of a full synergy oil industry package – being a tax haven nation helps too!
- Singapore’s economic skyrocketing was to begin with fueled by oil refineries back in 1960s and 1970s (and it has been known for decades that the burning of fossil fuels causes global warming; read this ‘article’).
- If all dilemmas² regarding greenhouse gases and moral responsibilities for the climate change were to be cracked scientifically and administratively before making an operative international binding agreement, then the initial process will last forever (not unlike the UN process).
.
¹Global CO2 Emissions from marine bunkers were 2% of the global CO2 Emissions from fossil fuels in 2011.
²Examples of greenhouse gas dilemmas: 1) Is it fair that domestic consumption of goods produced abroad does not burden domestic CO2 Emissions accounting?, 2) Who can be held responsible for methane emissions from melting permafrost in e.g. Russia caused by global CO2 Emissions from fossil fuels, say, since 1850?, 3) Is it fair that driving, consuming and flying abroad does not burden CO2 Emissions accounting at home?, 4) Should countries be held responsible for deforestation (and derived CO2 Emissions) before 1990, as they often do after?, 5) Who is responsible for carbon emissions from forest fires and forest decay due to climate change?, and 6) Should CO2 Emissions from cement production be equated with emissions from fossil fuels from consumption of energy?
In ClimatePositions the payments of the accumulated national Climate Debt leads to boosted financing of climate and environmental projects worldwide. If Singapore paid it’s Climate Debt of $133 billion (2.9% of the national GDP(ppp-$) annually since 2000), then the country would qualify for allocation of Global Climate Funding to CO2 Emission reduction projects (in a better world than the present!).
.
Information on national GDP(ppp-$) per capita: Worldbank (links in the menu “Calculations”).
Source on CO2 Emissions (used in ClimatePositions): EIA, U.S. Energy Information Administration (links in the menu “Calculations”).
Data on preliminary national CO2 Emissions are from Global Carbon Project (links in the menu “Calculations”).
IEA’s data on CO2 Emissions (including national emissions from marine bunkers, pdf page 67): ‘IEA Statistics 2013 edition: CO2 from fuel combustion (pdf)’.
Read about Singapore’s CO2 Emissions (and marine bunkers): ‘LowCarbonSG’ and the history of refinery: ‘Singapore: The Energy Economy 1960-2010‘.
Drawing by Claus Andersen, 2015.
Comments are closed.