United States’ giant share of the global Climate Contributions (climate debt)
2013
United States was the 7th worst performing country out of 145 in ClimatePositions 2010 (see the menu Contributions/ Per Capita US$ Rank). What make United States the major climate problem on a global scale however, is the country’s size, wealth and failed performance.
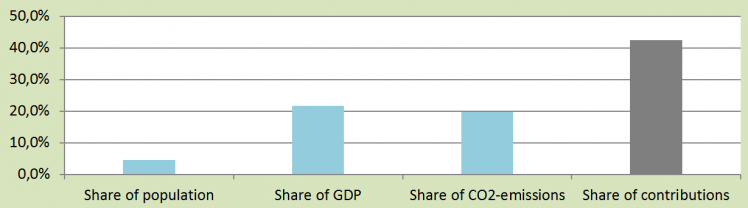
The diagram shows United States global share of: 1) Population (4.6%), 2) GDP+ (21.6%), 3) CO2 emissions 2006-2010 (19.7%) and 4) Climate Contributions (42.5%). Or to put it bluntly: United States 4.6% the world Population must pay 42.5% of the global costs of climate change in a world more fairly than the present. The total United States Contribution (debt) was 1,203 billion US$ in 2010 (accumulated since 2000). One can guess why United States rejects to participate in a binding climate agreement!
The main reason for the United States’ failure performance since 2000 is the continuous high level of CO2 Emissions (carbon dioxide). In 1990-1999 the average annual CO2 Emission per capita was 20.1 tons and in 2000-2010 the figure was 19.7 tons.
Note that the CO2 Emissions under president Barack Obamas have dropped to 17.8 tons per capita (average of 2009-2011).
Source on CO2 emissions: EIA, U.S. Energy Information Administration (links in the menu “Calculations”).
Information on national GDP(ppp-$) per capita is from Worldbank (links in the menu “Calculations”). Read about GDP+ in the submenu “Indicators”.
Data on national and global populations are from the EIA, U.S. Energy Information Administration (links in the menu “Calculations”).
Comments are closed.