2012 update of GDP in ClimatePositions
2014
The annual national GDP(ppp-$) (standard of living measured by purchasing power) has a direct impact on the Climate Contributions. Updating of GDP for 2011 and 2012 are now entered ClimatePositions (Excel) and for most countries, this means considerable increases in the Climate Contribution (climate debt). In connection with the GDP update, a minor simplification of the calculation method has been made (recent years are still weighted more than previous years in GDP+).
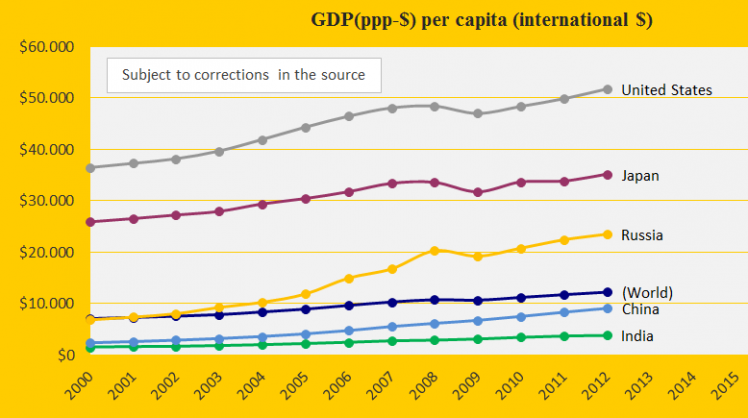
The diagram shows the updated (and revised) GDP(ppp-$) 2000-2012 for the five largest CO2 Emitters: China, United States, Russia, India and Japan.
Below are ranked the 18 countries with the largest total Climate Contributions (climate debt) in billion US$ in 2010 with the updated Contributions in January 2014 to the right (in yellow). The national Climate Contributions are accumulated since 2000 (see the indicator update status and the current status of all 145 countries in the menu “Calculations (Excel)”. The increasing Contributions reflect the countries’ inability to make the required CO2 reductions and implement a green transition.
Note: Recalculated Feb. 2014 due to adjustments in the data source of CO2 Emissions 1990-2010 (see the correct Contributions 2010 in the menu “Calculations”).
| 1. | United States | $1,203 | $1,565 |
| 2. | China | $185 | $306 |
| 3. | Japan | $181 | $230 |
| 4. | Canada | $116 | $146 |
| 5. | Australia | $94 | $122 |
| 6. | South Korea | $93 | $125 |
| 7. | Russia | $88 | $141 |
| 8. | Germany | $88 | $116 |
| 9. | France | $57 | $72 |
| 10. | Saudi Arabia | $56 | $85 |
| 11. | United Kingdom | $54 | $69 |
| 12. | Spain | $54 | $65 |
| 13. | Netherlands | $52 | $66 |
| 14. | Singapore | $48 | $68 |
| 15. | Italy | $42 | $51 |
| 16. | U. Arab Emirates | $37 | $44 |
| 17. | Iran | $32 | $45 |
| 18. | Belgium | $27 | $27 |
Information on national GDP(ppp-$) per capita: Worldbank (links in the menu “Calculations”). Read about GDP+ in the submenu ”Indicators”.
Comments are closed.