65 Contribution Free countries…GDP-ranked (with Income Equality, Life Expectancy and Environmental Performance)
2014
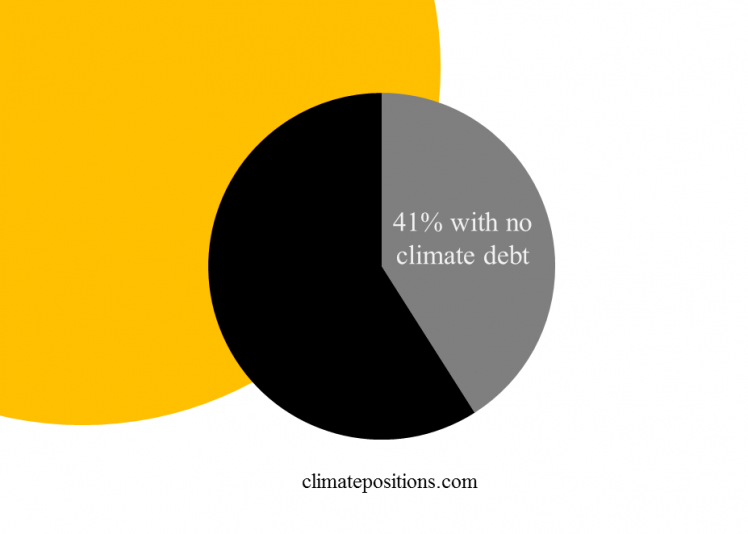
65 out of 147 countries with full data in ClimatePositions are Contribution Free (no climate debt). 41% of the world’s population lives in these Contribution Free countries and they emitted only 9% of the global carbon dioxide from fossil fuels in 2012 – without India the corresponding figures are 24% of the global population and 3% of the emissions.
The table below shows the 65 Contribution Free countries ranked by GDP(ppp-$) per capita, with Income Equality (‘Atkinson Index‘), Life Expectancy and Environmental Performance. The world’s average GDP(ppp-$) per capita was $13.791 in 2012. Analysis and comments see below the table – the color codes are explained in the bottom.
——————————————————————————–
| . | Contribution | GDP(ppp-$) | Income | Life | Environmental |
| . | Free countries | per capita | Equality | Expectancy | Performance |
| . | Avg.:$4,424 | Avg.: 26 | Avg.: 63 | Avg.: 74 | |
| . | . | . | . | . | . |
| 1. | Cuba | $19,474 | ÷¹ | 79 | 108 |
| 2. | Gabon | $18,347 | 20 | 63 | 92 |
| 3. | Azerbaijan | $16,166 | 5 | 71 | 109 |
| 4. | Costa Rica | $13,388 | 34 | 80 | 115 |
| 5. | Colombia | $11,840 | 42 | 74 | 100 |
| 6. | Peru | $11,103 | 31 | 75 | 89 |
| 7. | Albania | $10,154 | 18 | 77 | 108 |
| 8. | Sri Lanka | $9,010 | 20 | 74 | 106 |
| 9. | Mongolia | $8,442 | 12 | 68 | 88 |
| 10. | El Salvador | $7,572 | 34 | 73 | 86 |
| 11. | Bhutan | $7,314 | 25 | 68 | 92 |
| 12. | Guatemala | $7,107 | 43 | 72 | 95 |
| 13. | Paraguay | $7,097 | 35 | 72 | 77 |
| 14. | Morocco | $6,897 | 23 | 71 | 102 |
| 15. | Georgia | $6,819 | 26 | 74 | 93 |
| 16. | Swaziland | $6,502 | 38 | 49 | 74 |
| 17. | Philippines | $6,110 | 25 | 69 | 87 |
| 18. | Congo (Brazz.) | $5,730 | 30 | 59 | 78 |
| 19. | Nigeria | $5,535 | 34 | 53 | 77 |
| 20. | India | $5,138 | 16 | 66 | 61 |
| 21. | Vietnam | $4,998 | 15 | 76 | 75 |
| 22. | Laos | $4,465 | 17 | 68 | 79 |
| 23. | Pakistan | $4,437 | 11 | 67 | 68 |
| 24. | Nicaragua | $4,368 | 31 | 75 | 99 |
| 25. | Moldova | $4,223 | 19 | 69 | 105 |
| 26. | Yemen | $3,831 | 18 | 63 | 59 |
| 27. | Ghana | $3,732 | 27 | 61 | 63 |
| 28. | Sudan | $3,607 | ÷¹ | 62 | 49 |
| 29. | Zambia | $3,043 | 43 | 58 | 82 |
| 30. | Kyrgyzstan | $2,920 | 24 | 68 | 80 |
| 31. | Mauritania | $2,878 | 21 | 62 | 54 |
| 32. | Cambodia | $2,839 | 20 | 72 | 70 |
| 33. | Côte d’Ivoire | $2,795 | 28 | 51 | 78 |
| 34. | Cameroon | $2,596 | 23 | 55 | 72 |
| 35. | Papua New Gui. | $2,424 | ÷ | 62 | 81 |
| 36. | Bangladesh | $2,405 | 28 | 71 | 50 |
| 37. | Tajikistan | $2,361 | 15 | 67 | 62 |
| 38. | Senegal | $2,212 | 23 | 63 | 80 |
| 39. | Kenya | $2,189 | 36 | 62 | 73 |
| 40. | Nepal | $2,155 | 18 | 68 | 73 |
| 41. | Chad | $2,038 | 21 | 51 | 61 |
| 42. | Afghanistan | $1,926 | 11 | 61 | 42 |
| 43. | Benin | $1,716 | 24 | 59 | 64 |
| 44. | Zimbabwe | $1,696 | 36 | 60 | 98 |
| 45. | Tanzania | $1,685 | 21 | 62 | 71 |
| 46. | Haiti | $1,631 | 48 | 63 | 37 |
| 47. | Mali | $1,631 | ÷ | 55 | 36 |
| 48. | Sierra Leone | $1,610 | 31 | 46 | 43 |
| 49. | Gambia | $1,604 | 27 | 59 | 58 |
| 50. | Burkina Faso | $1,555 | 24 | 56 | 80 |
| 51. | Rwanda | $1,406 | 40 | 64 | 70 |
| 52. | Madagascar | $1,384 | 36 | 65 | 53 |
| 53. | Uganda | $1,357 | 27 | 59 | 77 |
| 54. | Togo | $1,337 | 24 | 57 | 55 |
| 55. | Guinea-Bissau | $1,251 | 33 | 54 | 71 |
| 56. | Ethiopia | $1,240 | 10 | 64 | 78 |
| 57. | Guinea | $1,237 | 31 | 56 | 55 |
| 58. | Eritrea | $1,200 | ÷ | 63 | 51 |
| 59. | Mozambique | $985 | 28 | 50 | 59 |
| 60. | Centr. Afric. R. | $948 | 28 | 50 | 85 |
| 61. | Niger | $899 | 18 | 58 | 71 |
| 62. | Liberia | $796 | 19 | 61 | 47 |
| 63. | Malawi | $753 | 25 | 55 | 79 |
| 64. | Burundi | $750 | 13 | 54 | 51 |
| 65. | Dem. Rep. Congo | $697 | 31 | 50 | 49 |
——————————————————————————–
The table above is read as follows with Azerbaijan as an example:
- The GDP(ppp-$) per capita is $16,166 annually (ranked 3rd).
- The Income Equality is 5 (the most equal among the listed countries, where 48 is the most inequal).
- The Life Expectancy is 71 years at birth (the listed countries goes from 46 to 80 years).
- The Environmental Performance is 109 (the listed countries goes from 36 to 115, where the latter is the best).
The three diagrams below show the correlation between the GDP(ppp-$) per capita and Income Equality, Life Expectancy and Environmental Performance. Generally, prosperity seems unrelated to Income Equality among the Contribution Free countries – however, the national differences are immense. By contrast, both Life Expectancy and Environmental Performance increases significantly along with growing prosperity (what causes what is another matter).
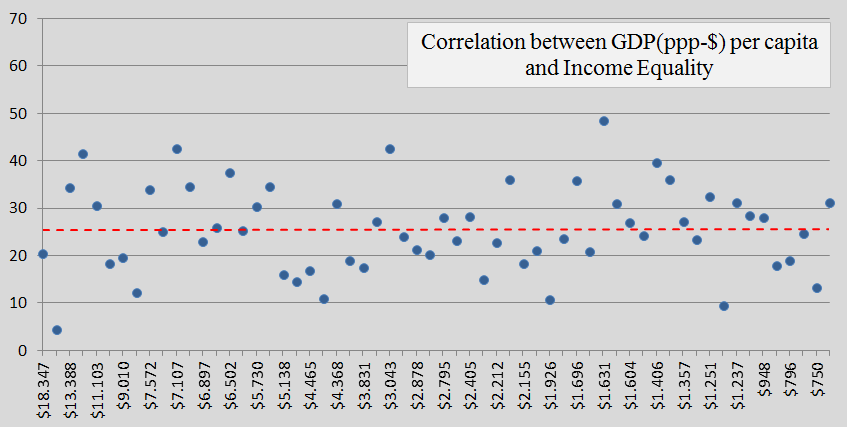
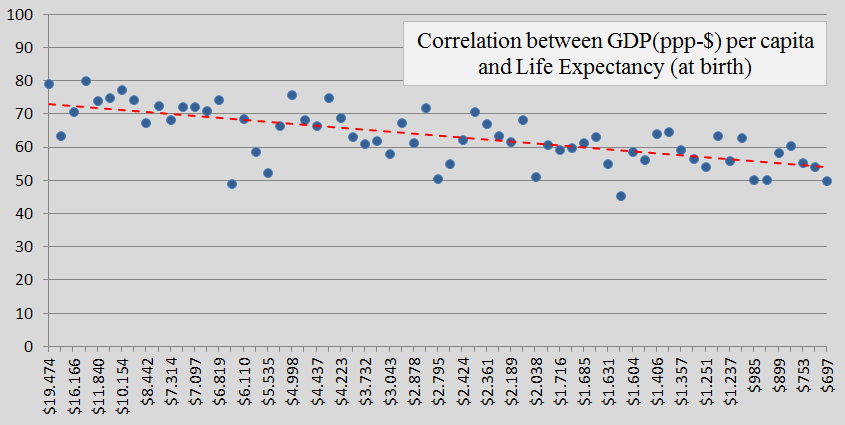
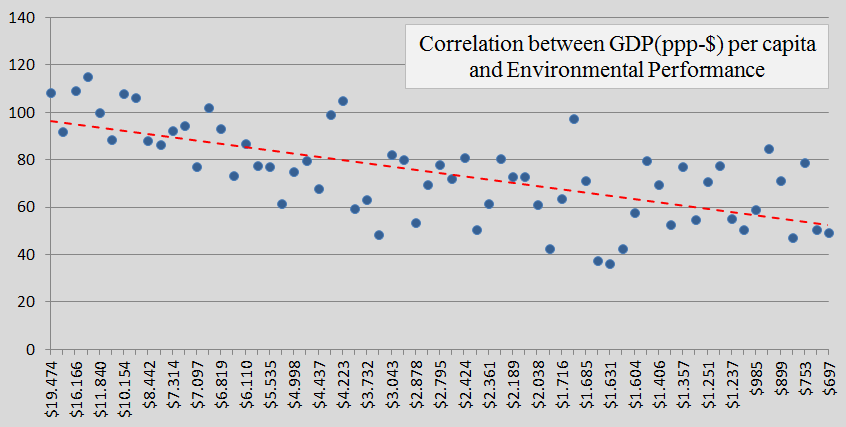
The color codes in the table show the deviations from the general trend (shown as a red dashed line in the three diagrams above). Blue is clearly better performance than the generel trend among the 65 Contribution Free countries and the red is clearly worse.
Only the extremely poor Ethiopia perform clearly better than the general trend on all three indicators and only Swaziland perform clearly worse on all three.
¹Data is missing, however, Cuba is slightly more inequal than Bhutan in GPI Gini (25 on the Atkinson list) and Sudan is slightly more inequal than Chad in GPI Gini (21 on the Atkinson list).
41 countries with 36% of the global population have a climate debt per capita of less than half the world average, which is $769. Along with the 65 Contribution Free countries the 106 countries represent 77% of the global population, 49% of the carbon dioxide emissions from fossil fuels and 15% of the climate debt or $772 billion. The remaining 41 countries with 13% of the global population are responsible of 85% of the total climate debt (see the ‘ranking’).
14 countries with missing indicator data are unquestionably also Contribution Free (no climate debt): Somalia, Comoros, Myanmar, Timor-Leste, Solomon Islands, Kiribati, Western Sahara, Occupied Palestinian Ter., Vanuatu, Cape Verde, Sao Tome and Principe, Djibouti and Samoa.
.
Information on national GDP(ppp-$) per capita is from ‘Worldbank’.
Data on Income Equality and Life Expectancy are from United Nations Development Programme: ‘Human Development Reports’ (2014) (download all data). Read the definition of the ‘Income Equality Atkinson Index‘.
National ‘Environmental Performance Index’ is produced by Yale and Columbia University.
Comments are closed.