During COP15 in Copenhagen in 2009, the horrifying truth dawned on me: the rich countries which are largely responsible for the climate change, will not contribute to a binding global climate agreement. Shortly after the summit, I began my search for knowledge and attempt to place the national moral responsibility for the collapse of common sense in the world community. Before COP19 in Warsaw in 2013 the site climatepositions.com was presented. (Claus Andersen, 2013)
Since 2013 several changes of calculation methods and Indicators have been made, however, the original concept of a fair Climate Damage Pricing or Climate Debt Worldvide is unchanged.
The four diagrams below illustrates the calculation approach since November 2025 (note that the indicators of Biodiversity Loss and Nuclear Power are no longer included in the calculations).
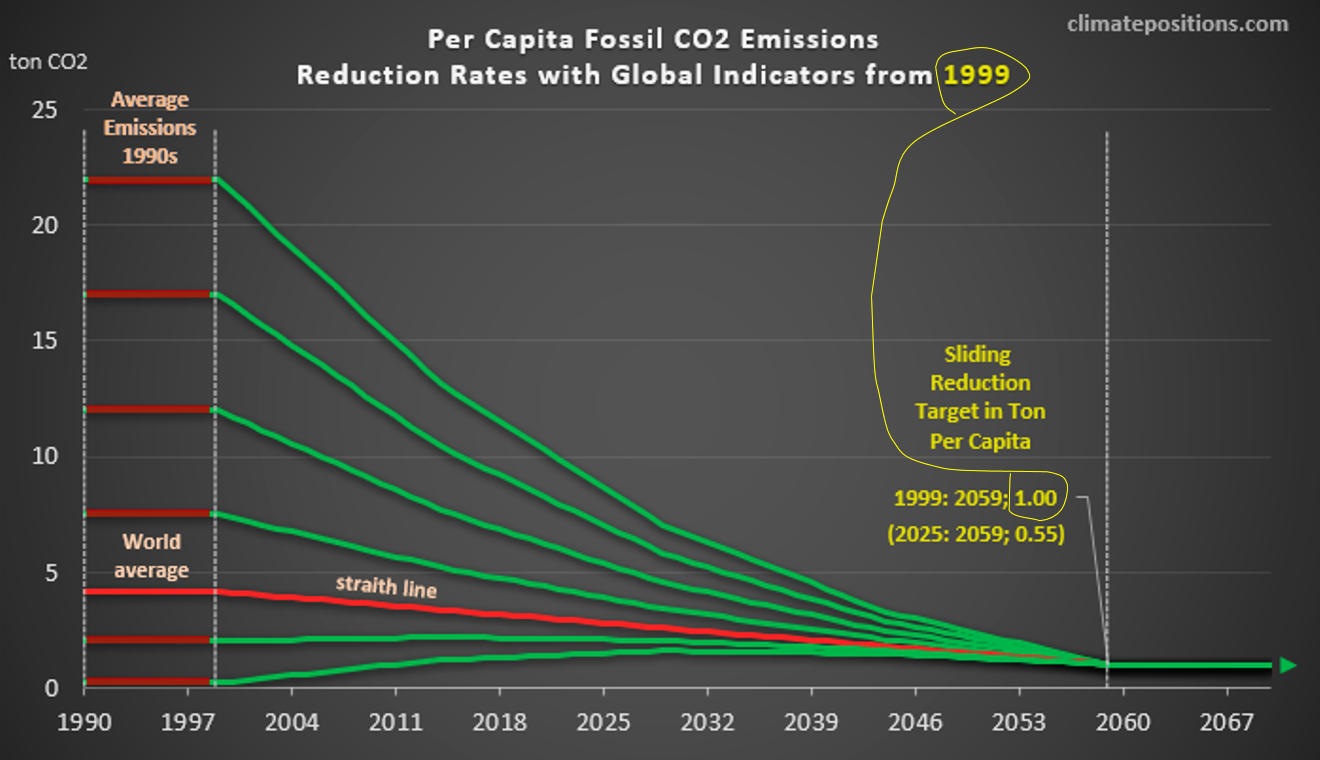
The diagram above illustrates the general concept: All countries must reduce Fossil CO2 Emissions Per Capita towards the same “Sliding Global Reduction Target” by 2059.
Baseline for national reduction rates are the average Per Capita Fossil CO2 Emissions 1990-1999. The national reduction rate is called “Free Level of Emissions”. The accumulated CO2 Exceedance since 2000 is the calculation basis of the Climate Damage Pricing (Int. $).
National wealth (GDP-ppp Per Capita) determines the actual amount, meaning that e.g. dobble GDP-ppp results in dobble Climate Damage Pricing. The Climate Debt arises by deducting Climate Funds (Climate Change finansing) from the Climate Damage Pricing.
Global average Fossil CO2 Emissions Per Capita (Global baseline at 4.2 ton CO2 is set to a straith reduction line (the red line in the diagram below). The Sliding Global Reduction Target by 2059 is set at 1.00 ton of Fossil CO2 Per Capita with Global Indicators by 1999 (see the yellow bubbles).
The Global Indicators are: 1) Global Warming, 2) CO2 in the Atmosphere and 3) Global Population. Increasing values of the three Global Indicators leads to a lower Sliding Global Reduction Target (getting closer to zero Fossil CO2 Emissions). By January 2025 the Sliding Global Reduction Target was 0.55 ton CO2 Per Capita by 2059 (compared to 1.00 ton in 2059 with Global Indicators from 1999).
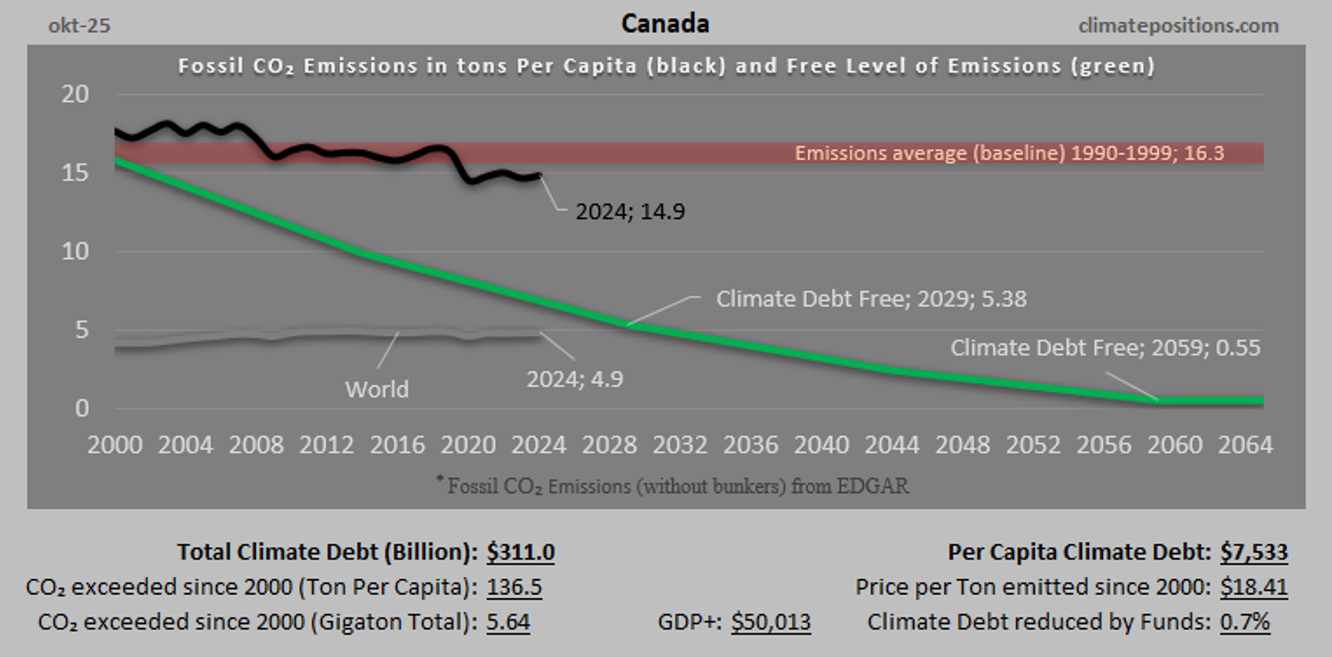
The diagram above with Canada is a screenshot from the Calculation (Excel) by October 2025 (opdated versions are available in the menu “Calculation (Excel)”). The reddish belt shows the average Fossil CO2 Emissions Per Capita 1990-1999 (21.7 ton). The black curve shows Canadas annual Fossil CO2 Emissions Per Capita (14.9 ton by 2024). The green line is the current Free Level of CO2 Emissions Per Capita. Currently, Canadas Free Level of Emissions is 5.38 ton by 2029 and 0.55 ton by 2059.
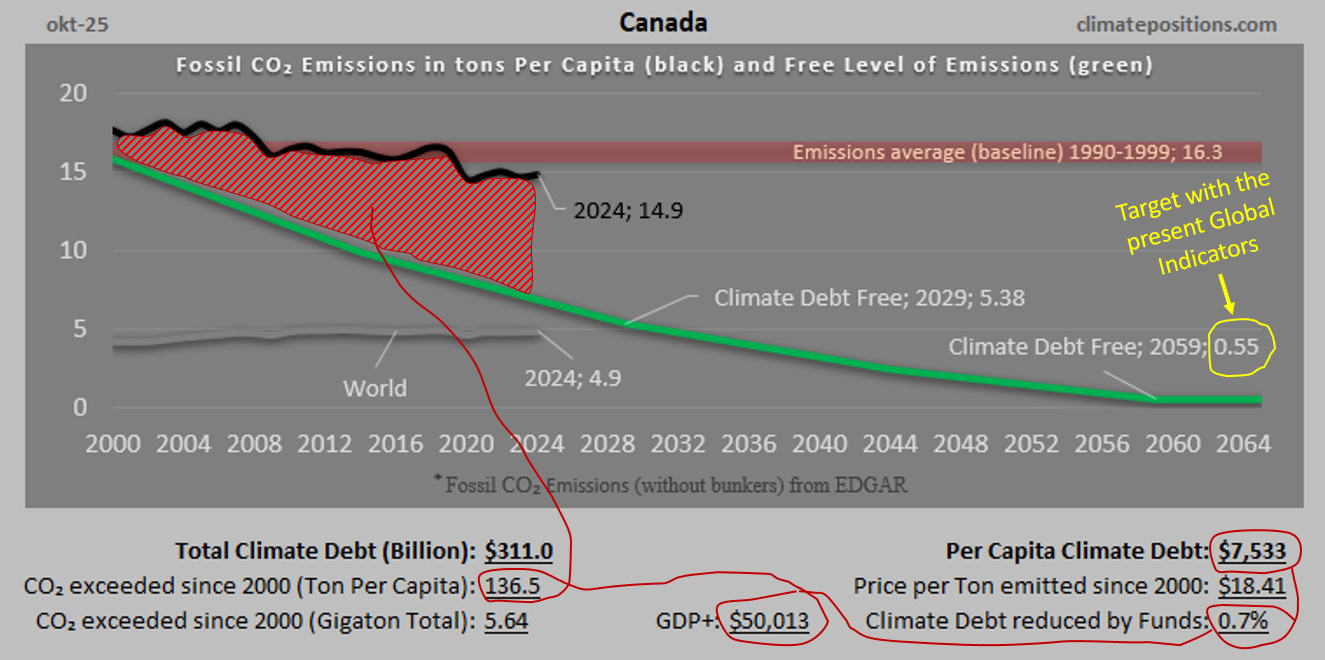
The yellow bubble in the diagram above shows the sliding impact of the rising Global Indicators between 1999 and 2025: The Sliding Reduction Target 2059 has decreased from 1,00 ton Per Capita to 0.61 ton in 25 years.
The red hatching between the actual Fossil CO2 Emissions Per Capita (black curve) and the Free Level of Emissions (green line) shows Canadas Fossil CO2 Exceedance (the red bubble: 136.5 ton Per Capita). The CO2 Exceedance times GDP+ (the red bubble: $50,013 Per Capita) yields the Climate Damage Pricing. The Climate Debt (red bubble: $7,533 Per Capita) arises by deducting Climate Funds (Climate Change financing: 0.7%) from the Climate Damage Pricing.
GDP+ is GDP-ppp since 2000, where the average of the last five years counts equally (50%) to the average of the previous years (50%). This method ensures a conservative growth in Climate Debt compared to the national wealth.
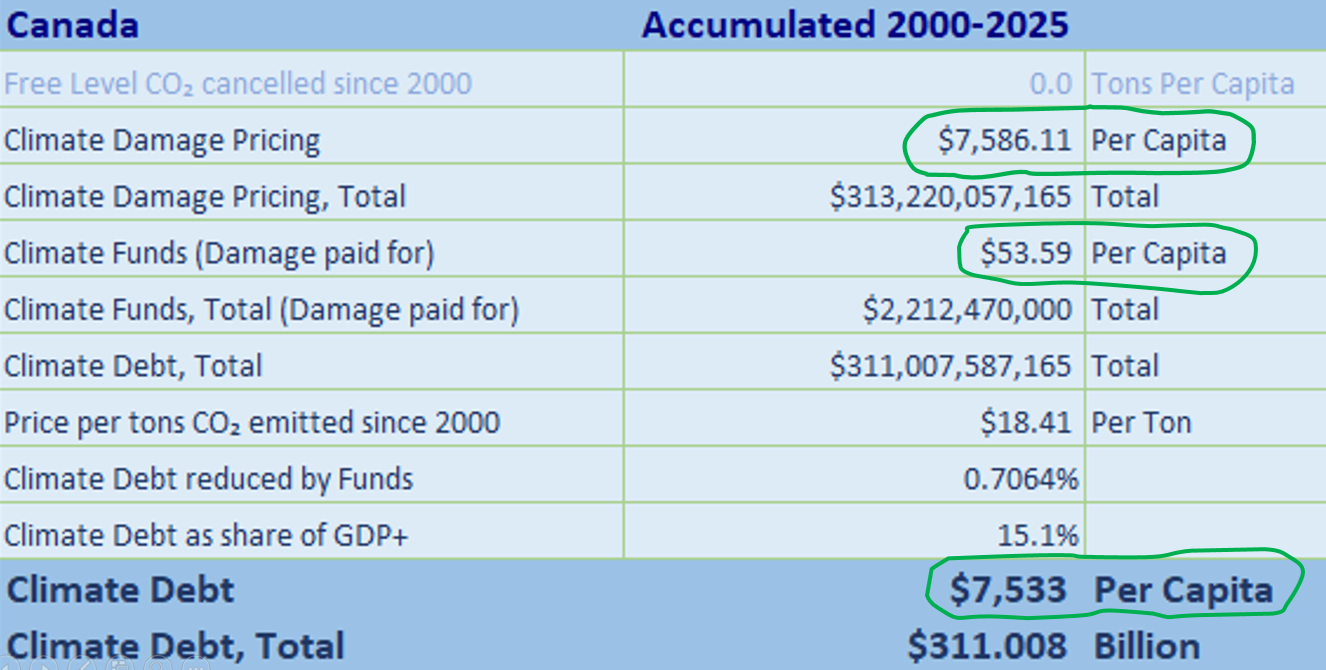
The screenshot above shows some key figures of Canada from the Calculation (Excel). The first line is not yet relevant to any country (might never be relevant). The green bubbles show: 1) The Canadian accumulated price on its Climate Damage Per Capita, 2) the accumulated deposited Multilateral Climate Funds (Canadas Climate Change Finansing Per Capita), and 3) the Climate Funds deducted from the Climate Damage Pricing to reach the accumulated Climate Debt Per Capita.