Climate performance: United Kingdom versus Ireland
2014
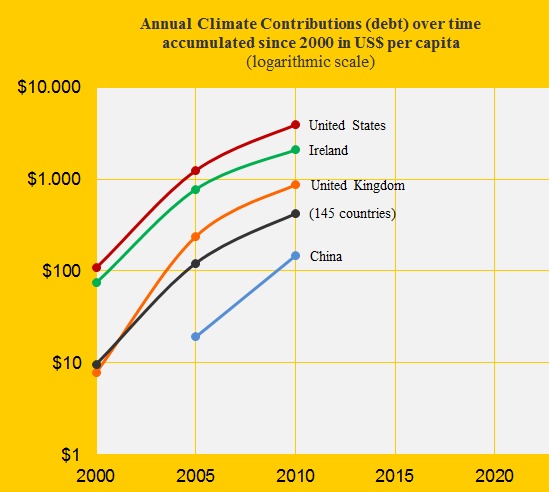
In ClimatePositions 2010, United Kingdom was the 26th worst performing country while Ireland was number 14 out of 145. The first diagram shows the two countries’ Climate Contributions (climate debt) per capita over time in comparison with the United States, China and the world average (note the logarithmic scale). See the changes in Climate Contributions per capita since 2010 ‘here’).
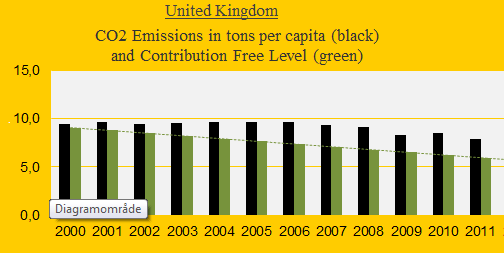
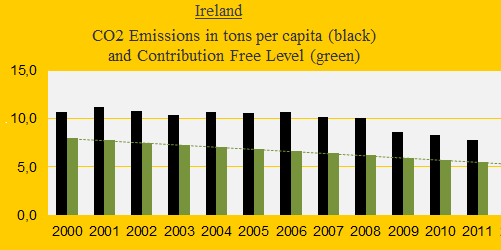
The CO2 Emissions of the United Kingdom have decreased to 7.9 tons per capita in 2011, compared with Ireland’s at 7.8 tons. See the emissions since 2000 in the two diagrams below. The distance between the green and the Black bars shows the excess CO2 (the final calculation basis). The green dashed line (the Contribution Free Level) is determined by the updated indicator values (read more ‘here’) and the CO2 Emission Level in the 1990s (see the next section).
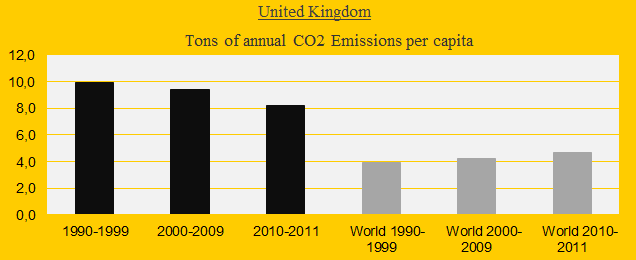
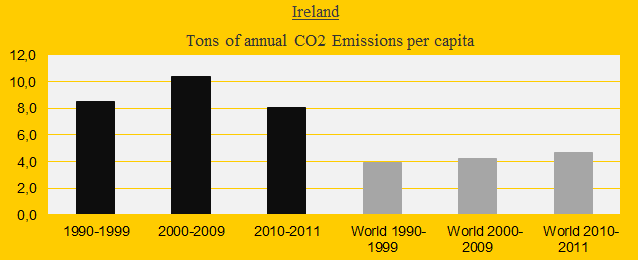
The two diagrams below illustrate why Ireland’s Climate Contribution (debt) today is larger than the one of United Kingdom. In the 1990s the average CO2 Emissions in Ireland was 8.5 tons per capita and in the period 2000-2011 the average emissions was 10.0 tons (the Contribution Free Level was 6.7 tons). United Kingdom emitted 9.9 tons in the 1990s and 9.2 tons in 2000-2011 (the Contribution Free Level was 7.5 tons) – the drop in emissions was evident although minor. The only positive thing to say about the Irish performance is that emissions decreased simultaneously with the financial crisis in 2008.
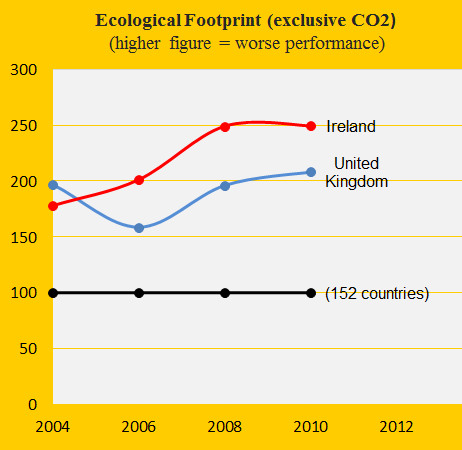
The Ecological Footprint (without CO2 Emissions) in Ireland was the 19th largest among 152 countries in 2010. United Kingdom was ranked 37. See the development since 2004 in the diagram below (with average of 152 countries set at 100). If Irelands Ecological Footprint was like that of the United Kingdom, then the total saving in Climate Contribution would be $156 million.
The last diagram shows the development in GDP(ppp-$) for Ireland, United Kingdom, United States, China, India and the world average. If Irelands GDP(ppp-$) was like that of the United Kingdom, then the total saving in Climate Contribution would be $1.7 billion. Economic wealth created by polluting activities ant and world-damaging behavior must be compensated for by a global Climate Environmental Fund if Homo sapiens shall step down from their top position as the world’s most invasive species.
.
Source on CO2 Emissions: EIA, U.S. Energy Information Administration (links in the menu “Calculations”).
Source on Ecological Footprint: WWF reports “The Living Planet” published 2006-2012 (links in the menu “Calculations”).
Information on national GDP(ppp-$) per capita: Worldbank (links in the menu “Calculations”).
Comments are closed.
