New greenhouse gas targets of the European Union: 40% reductions in 40 years

2014
The 28 countries in the European Union (EU) have recently decided three new greenhouse gas reduction targets of the EU by 2030 in comparison with 1990 levels:
- Binding reduction of greenhouse gas emissions by 40%.
- Binding increase of the share of renewable energy to 27% of the energy consumption.
- Indicative (optional) increase of energy efficiency by 27%.
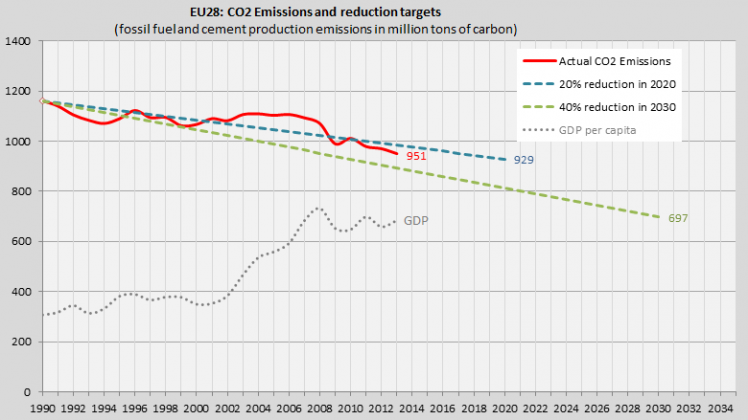
Back in 2008 the EU agreed on a joined reduction of greenhouse gas emissions by 20% by 2020, compared to 1990. Whether the new reduction targets are ambitious or depressively droopy depends on your hopes for the future and who you compare with. The top diagram shows the CO2 Emissions (from fossil fuels and cement production) of EU in 1990-2013. The blue dashed line illustrates a 20% CO2 Emission reduction by 2020 and the green dashed line illustrates a 40% reduction by 2030. Note that the graphs do not reveal the exact greenhouse gas emission inventories of the EU. Burden sharing of the new targets in the EU is not yet agreed. The grey dashed line shows the GDP per capita in the EU. The economic upturn between 2002 and 2008 coincides with the failure of emission reductions – after the financial crash in 2008 emissions began to decrease again.
In 2013 the CO2 Emissions of the EU were 18% less than in 1990 (18% reduction in 22 years), whereas the world emissions were 61% larger than in 1990. EUs share of the world emissions decreased from 19% in 1990 to 10% in 2013. Symptomatic of development, the per capita CO2 Emissions of China exceeded the one of EU in 2013.
In ClimatePositions the CO2 Emission reductions since the millennium reduces the national Climate Contribution (climate debt). The continuously updated calculations (see the menu “Calculations (Excel)”) are identical for all countries and the size of the national climate debt depends on a number of indicators, not just CO2 Emissions (see the menu “Calculations/Indicators”).
.
European Commission (2030 framework for climate and energy policies): ‘http://ec.europa.eu/clima/policies/2030/index_en.htm‘
CO2 Emissions 1990-2013. Global Carbon Project: ‘http://cdiac.ornl.gov/GCP/‘
GDP per capita of the European Union: ‘http://data.worldbank.org/indicator/NY.GDP.PCAP.CD/countries‘ (download data)
Article in the Guardian: ‘http://www.theguardian.com/world/2014/oct/24/eu-leaders-agree-to-cut-greenhouse-gas-emissions-by-40-by-2030‘
Comments are closed.