Impressive performance by Costa Rica
2013
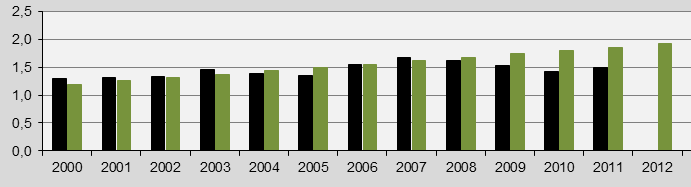
In 2010 ‘Costa Rica‘ was the only Contribution Free, full democratic country with a GDP(ppp-$) above the global average. The diagram above shows the national CO2 Emissions per capita (the black bars) and the Contribution Free Levels of CO2 Emissions (the green bars) in 2000-2011. Note that Costa Rica could have increased CO2 Emissions (carbon dioxide) from 1.2 ton CO2 per capita in 2000 to 1.9 tons in 2011 and still be Contribution free, due to other fine indicator values.
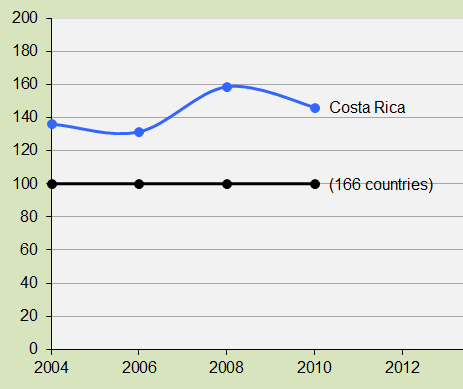
Costa Rica’s Environmental Performance was the 4th best in the world in 2004-2010 In the diagram below the average of 166 countries is set at 100. Had the performance been as miserabel as in Bahrain the national Contribution (climate debt) would have been 38 million US$ in 2012 instead of $0.
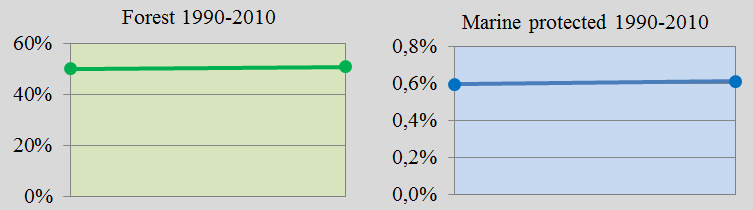
As illustrated in the diagram below forest (rainforest) covered 50.2% of the area in Costa Rica in 1990 and 51.0% in 2010 – impressive compared to other countries with high coverage of rainforest. Had Costa Rica cut down the same proportion of the national rainforests as Honduras the contribution (debt) would have been 570 million US$ in 2012 instead of $0. The protected marine area in Costa Rica was 0.60% of the total sea in 1990 and 0.61% in 2010.
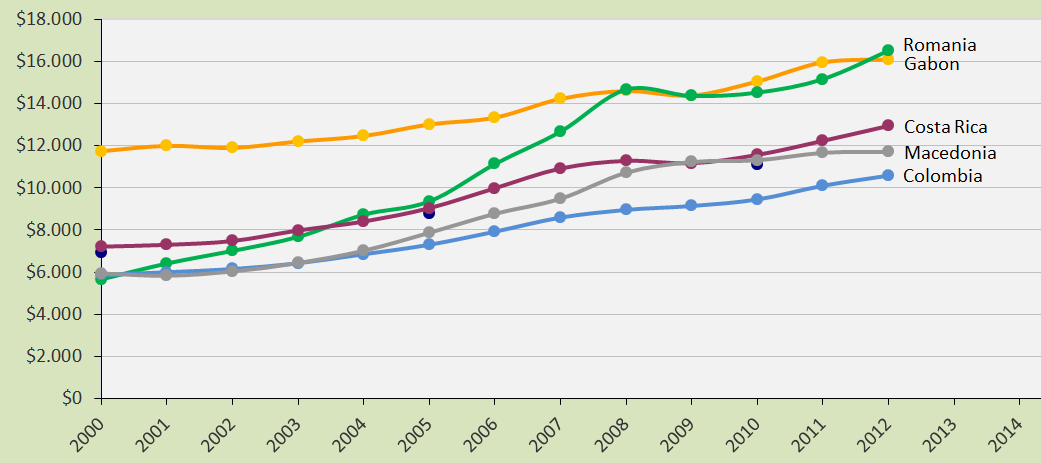
The diagram below shows the GDP(ppp-$) per capita in 2000-2012 for the top 5 Contribution Free countries in ClimatePositions. Subject to modifications in the data source. The dark blue dots (partially hidden) are the global average. Costa Rica’s GDP(ppp-$) per capita was $12,943 in 2012 and the Latin American country was the only full democracy among the five.
A hypothetical example: If all national and global indicator values stayed at the 2012 level until 2019, Costa Rica could emit a total of 34.5 tons of CO2 per capita in ClimatePositions 2000-2019 and still be Contribution Free.
Source on CO2 emissions: EIA, U.S. Energy Information Administration (links in the menu “Calculations”).
Data sources on environmental performance are from Yale and Columbia University reports, published 2006-2012 (links in the menu “Calculations”).
Data sources on national forest area are from the United Nations (UN)(links in the menu “Calculations”).
Information on national GDP(ppp-$) per capita is from Worldbank (links in the menu “Calculations”). Read about GDP+ in the submenu ”Indicators”.
Democratic Index is from Wikipedia (links in the menu “Calculations”).
Comments are closed.