China’s share of the global Climate Debt is growing fast
In 2010 China’s share of the global Climate Debt was 7.4% and by January 2016 it has grown dramatically to 13.3% (see the ‘ranking’). Since 2000 the Chinese share of the growing global CO2 Emissions has grown from 13.7% to about 29.0% (preliminary emissions by 2014). Luckily, the populous superpower has committed itself to pursue “efforts to limit the temperature increase to 1.5 °C” … according to the COP21 Paris Agreement. The following examines the development of CO2 Emissions, Environmental Performance, GDP(ppp-$), Climate Debt and Population (with respect to the one-child policy).
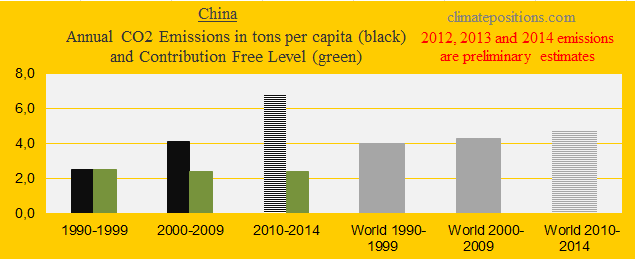
The first diagram (below) shows the Chinese per capita CO2 Emissions from fossil fuels (without bunker fuels) and cement production in decades in comparison with the world average. CO2 Emissions since 2012 are preliminary estimates. The green bars are the Contribution Free Level, determined by the level of CO2 Emissions in the 1990s and a number of continuously updated ‘indicators’.
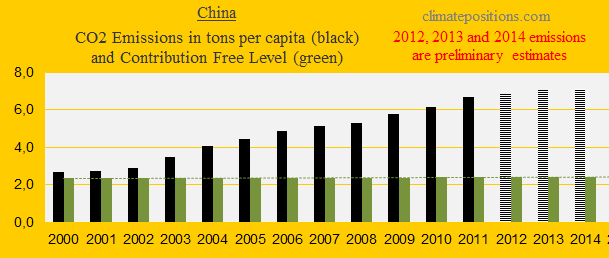
The diagram below shows the per capita CO2 Emissions from fossil fuels (without bunker fuels) and cement production since 2000. CO2 Emissions in 2012, 2013 and 2014 are preliminary estimates. Whether, the sky-rocking growth has peaked in 2014 only time will show. ‘EIA wrote September 2015’: “Economic deceleration, industry restructuring, and new energy and environmental policies have slowed the growth of coal consumption in China and are also driving more centralized and cleaner uses of coal. After nearly a decade of rapid growth, energy-based consumption of coal, which currently supplies two-thirds of China’s overall energy use, grew only 1% to 2% in 2012 and 2013 and was essentially flat in 2014.” According to ‘UNEP’, “China saw by far the biggest renewable energy investments in 2014 – a record $83.3 billion, up 39% from 2013.”
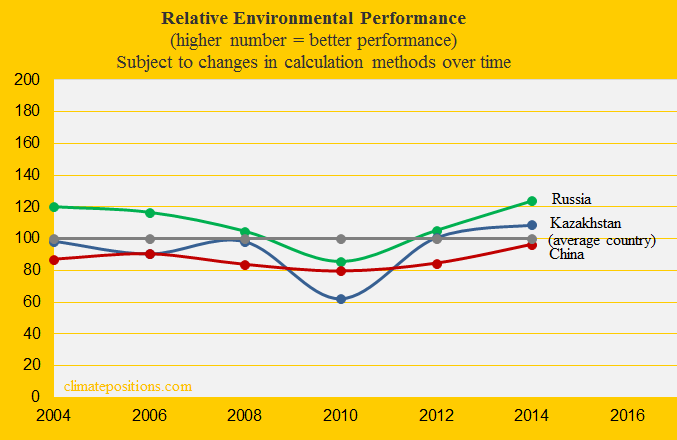
The relative Environmental Performance over time of China, Russia and Kazakhstan, with the world’s average set at 100, is shown below. The up-to-date ‘Environmental Performance Index’ published January 2016 (data-year is set at 2014 in the diagram) ranks China 109th among 180 countries. See ‘details on the Chinese performance’. The previous ‘Index published in 2014’ ranked China 118th. Note that Environmental Performance Index and Ecological Footprint Network provide completely different rankings and trends due to a different focus.
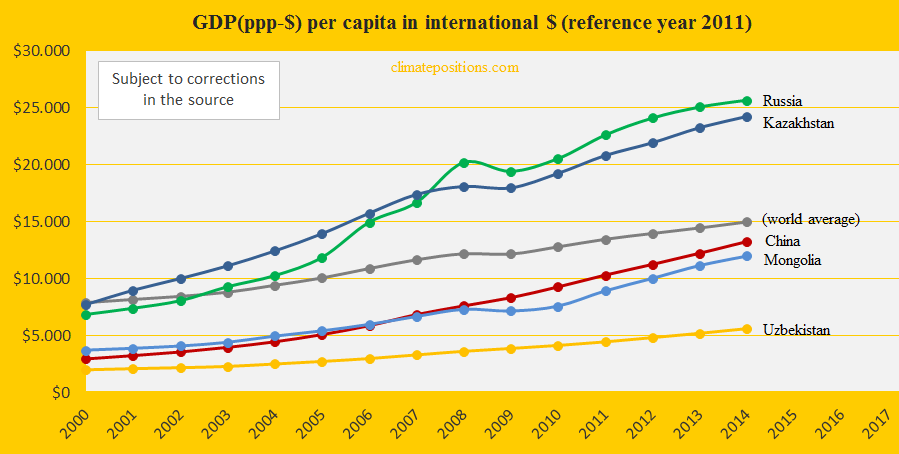
The diagram below shows the development of GDP(ppp-$) since 2000, in comparison with Russia, Kazakhstan, Uzbekistan, Mongolia and the world average. China is slightly below world average on wealth, while Russia and Kazakhstan are far ahead.
By January 2016 the Chinese per capita Climate Debt was $552 and the ‘ranking’ was 48th. The Climate Debts share of the GDP(ppp-$), annually since 2000, was 0.51% (see the ‘ranking‘). The development since 2005 is shown in the diagram below, along with the same group of countries. Kazakhstan and Russia are performing even worse than China and the others. [2010-values in the diagram has been corrected January 15th]
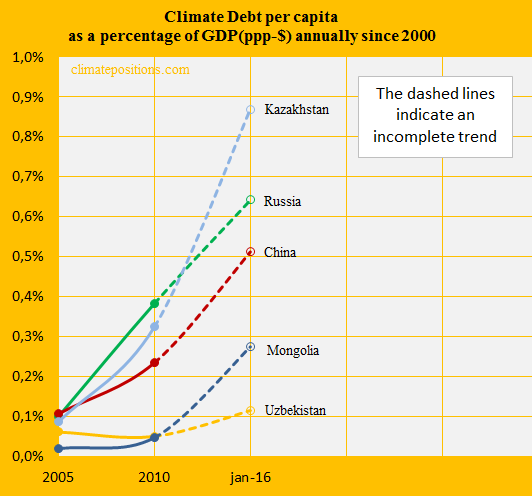
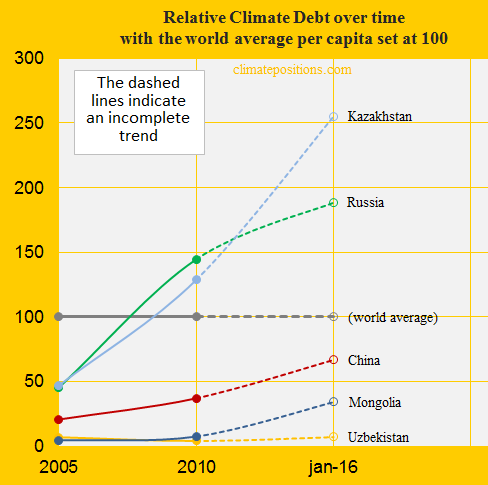
The next diagram shows the per capita Climate Debt since 2005, with the world average set at 100. Once again Kazakhstan and Russia are performing worse than the others. In real money the accumulated total Chinese Climate Debt increased from $190 billion in 2010 to $754 billion by January 2016 (see the ‘ranking’).
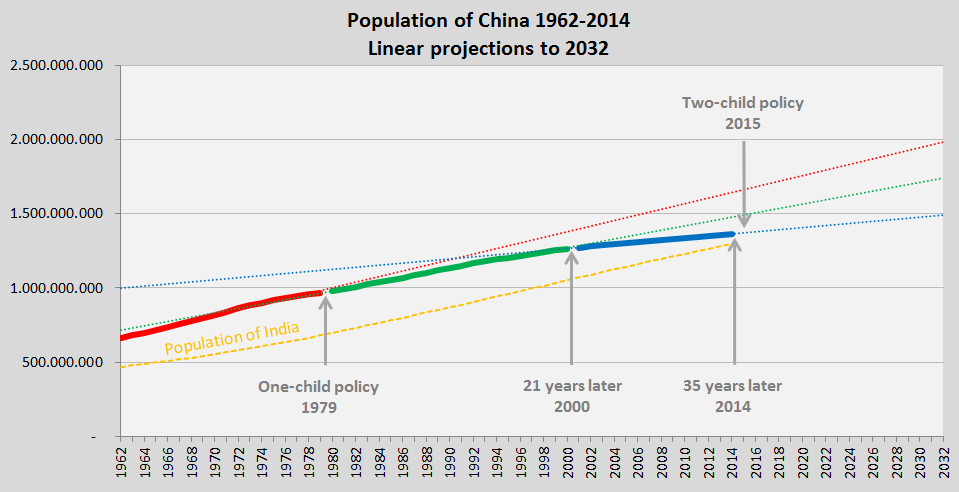
Back in 1979 China introduced the controversial ‘one-child policy’ and in 2015 it was altered to a two-child policy. The three-colored graph below shows the development of Population between 1962 and 2014; with linear projections to 2032 (separate projections for each of the three timespans). The projections are not scientifically founded, only illustrative. If the growth 1962-1979 (the red line) is projected this manner, then the Population of China would be 2.0 billion by 2032. If the growth 2000-2014 (the blue line) is projected, then the Population would be 1.5 billion by 2032. The diagram suggest that the planet might be 0.5 billion fewer people by 2032 due to the Chinese one-child policy – on a planet with a total expected Population of around 8.5 billion.
For comparison, the Population of India is shown in yellow (stippled).
.
The current accumulated Climate Debt of China is $ 751 billion. Without the Environmental Performance improvement, relatively, by 2016 (the publishing years), then the Climate Debt would have been $754 billion, or around $3 billion larger than the current.
.
Data on carbon emissions (CO2 Emissions) from fossil fuels (without bunkers) and cement production are from Global Carbon Project (CDIAC); (links in the menu “Calculations”).
Source on Environmental Performance: Yale and Columbia University reports, published 2006-2016 (links in the menu “Calculations”).
Information on national GDP(ppp-$) per capita: Worldbank.
Data on national and global Populations is from Worldbank (links in the menu “Calculations”).
PowerPoint collage (One-child policy and coal / 独生子女政策和煤炭) by Claus Andersen, 2016.
Comments are closed.