Carbon Brief: Global Carbon Budget and CO2 Emission scenarios (50% risk of 1.5C, 2.0C and 3.0C warming)

Based on IPCC’s recent synthesis report, published 2014, ‘Carbon Brief‘ has calculated the number of years we can continue with today’s emission level (and then stop emissions), and still keep global average temperature rise to no more than 1.5°C, 2°C or 3°C above pre-industrial levels – with a 33% risk, a 50% risk, and a 66% risk of failure. One out of nine figures suggest that five more years with the current level of CO2 Emissions (and then total stop) leaves us with a 33% risk of 1.5°C temperature rise.
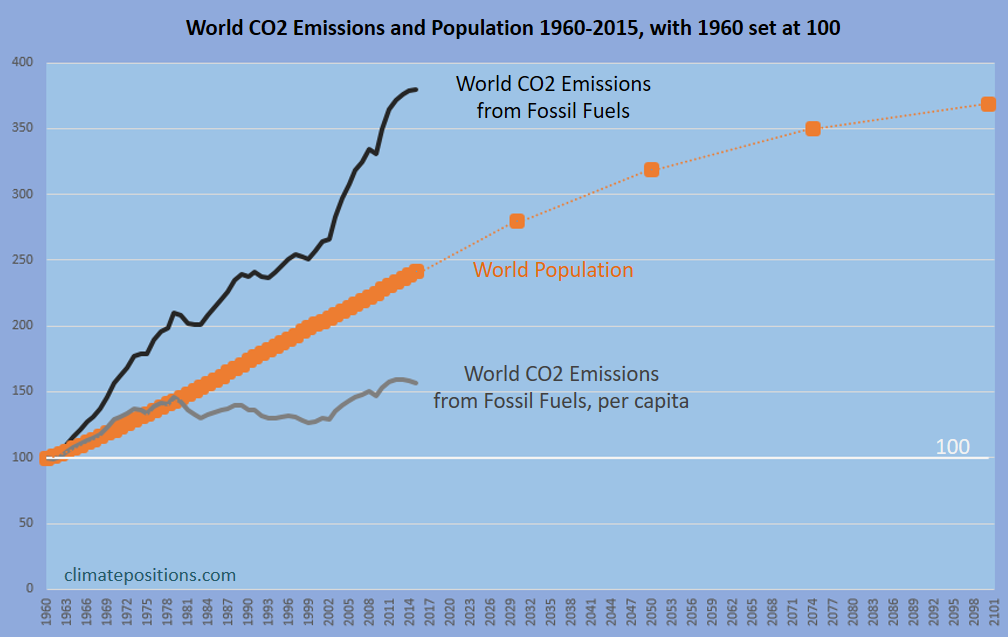
To frame the overall situation, the first diagram (below) shows three key graphs 1960-2015, with 1960 set at 100: 1) Global CO2 Emissions¹ from Fossil Fuels (without bunker) and cement, 2) Global Population (with projections to 2100), and 3) CO2 Emissions per capita. Even significant reductions of per capita emissions¹, will not necessary compensate for the projected population growth. 
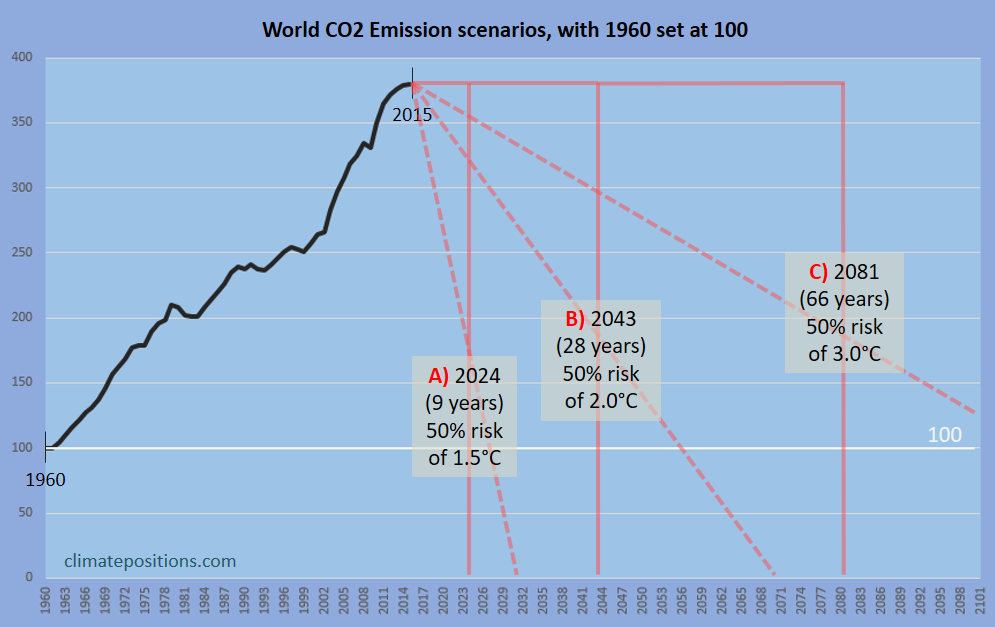
The next diagram illustrates the Carbon Brief calculations as for 50% risk of 1.5°C, 2°C or 3°C temperature rise, still with 1960-emissions set at 100. The result is that, less than 9 years of current CO2 Emissions would use up the 1.5°C budget with a 50% risk (or chance!) and the budget would be blown around 2024. As for 2°C and 3°C it would happen around 2043 (28 years) and around 2081 (66 years). The stippled lines show the three corresponding reduction lines if starting today. Note that neither the predicted dangerous ‘Feedback Loops‘, nor the latest scary warming data, are included in the calculations.
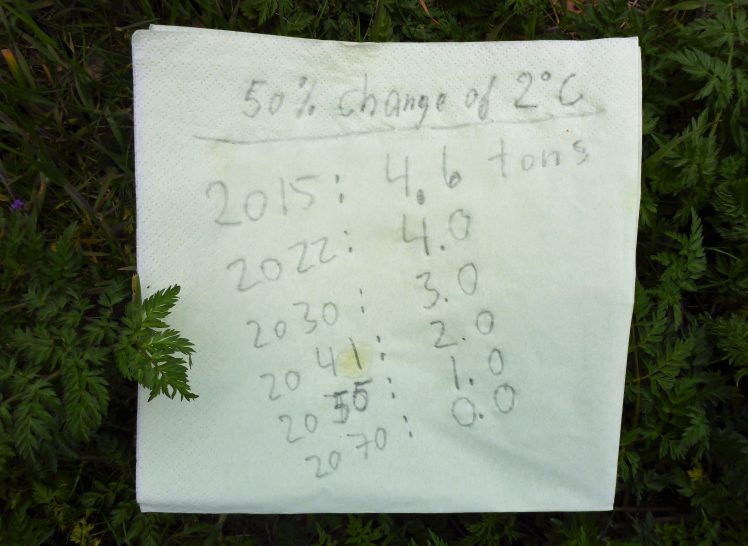
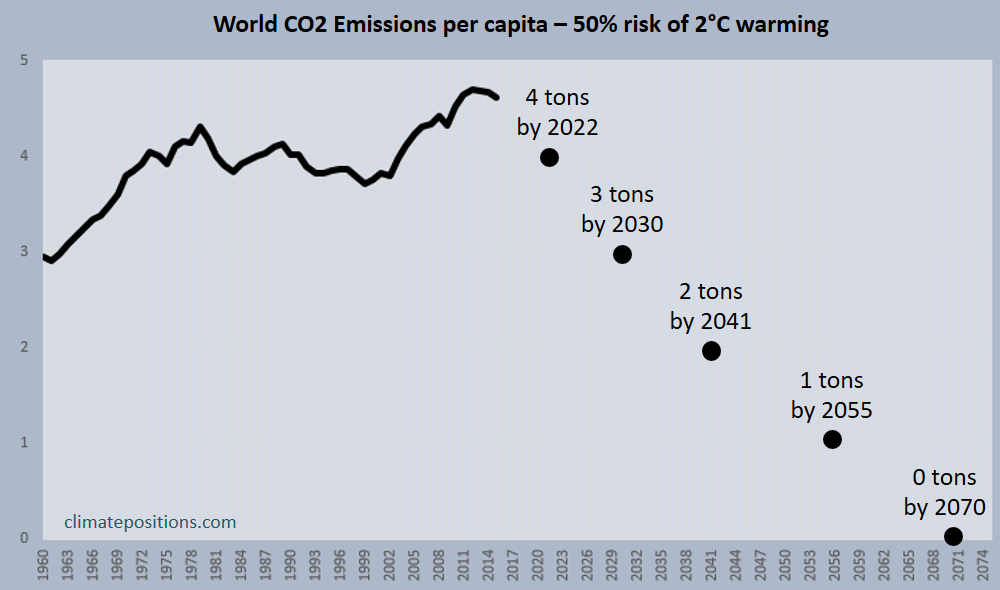
The last diagram shows the global per capita CO2 Emissions from Fossil Fuels (without bunker) and cement 1960-2015. In 2015, global emissions were 4.6 tons on average per capita. The black dots are calculated (by me) by combining the middle-stippled reduction line from above (50% risk of 2°C temperature rise), and the projections of Global Population. The result is that, by 2022 (in 5 years) global emissions must be no more than 4 tons per capita, by 2030 (in 13 years) emissions must be no more than 3 tons, etc. By 2070, emissions must be zero. Of cause, a 50% risk of surpassing the 2°C warming limit is totally unacceptable.
.
¹The graphs are excluding emissions from land use changes, as opposed to the Carbon Brief calculations. As a consequence, changes in land use could either improve or worsen the Fossil Fuel (and cement) emission scenarios in this article. In addition, we emit methane, nitrous oxide, ozone, hydrofluorocarbons, and other greenhouse gases – the IPCC synthesis report includes these greenhouse gases in the carbon budget.
.
Carbon Brief calculations: ‘https://www.carbonbrief.org/analysis-only-five-years-left-before-one-point-five-c-budget-is-blown‘.
Data on carbon emissions (CO2 Emissions) from Fossil Fuels (without bunkers) and cement production are from Global Carbon Project (CDIAC); (links in the menu Calculations / Sources & Links).
Article in the Guardian: ‘Planet could breach 1.5C warming limit within 10 years, but be aware of caveats‘.
Data on national and global Populations is from Worldbank (links in the menu Calculations / Sources & Links). Projections are from ‘UN‘.
Drawing by Claus Andersen, 2017.
Comments are closed.

