Share of global Climate Debt rank 7th, 8th and 9th: South Korea, Australia and Germany (combined responsible for 9% of Climate Debt and 5% of Fossil CO2 Emissions 2016)
2017
The diagram below shows ‘Share of global Climate Debt‘ in 2010, 2015 and 2017 of South Korea, Australia and Germany (ranked 7th, 8th and 9th). The South Korean share is stable over time, Australia’s is decreasing although at a slower rate lately, while Germany’s is increasing.

The following exposes the key-data in the Climate Debt calculations: Fossil CO2 Emissions, GDP, Environmental Performance, Ecological Footprint without carbon, Forest Cover, Primary Forests, Nuclear Power, Population trends and climate change financing. For comparison, Qatar, Kuwait and Iran (ranked 10th, 11th, and 12th in Share of global Climate Debt) are included.
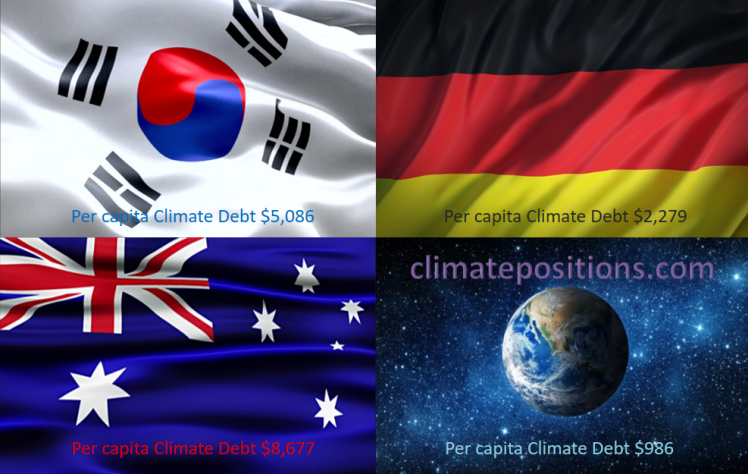
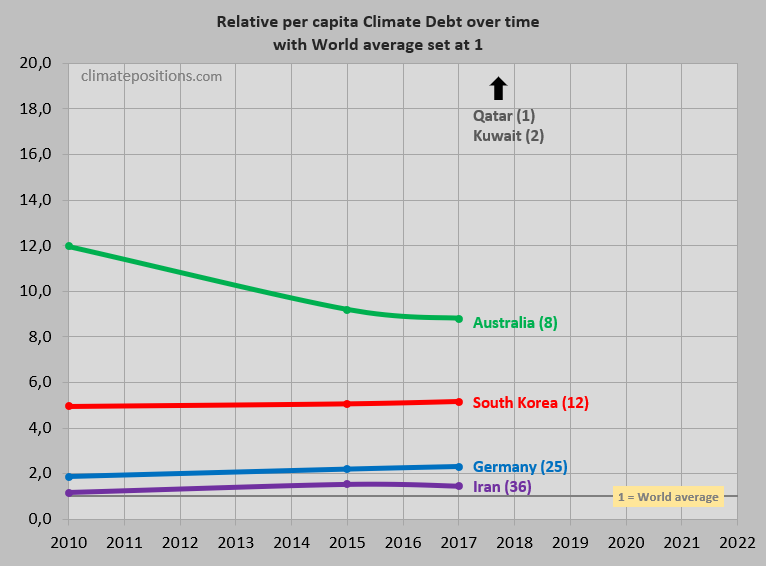
The ‘Per capita Climate Debt‘ accumulated since 2000 of South Korea, Australia and Germany are $5,086, $8,677 and $2,279, respectively. The diagram below shows the trends between 2010 and 2017, with world average set at 100, for the three countries as well as of Iran (Qatar and Kuwait burst the scale!). The per capita Climate Debt ranking by October 2017 is shown in brackets.
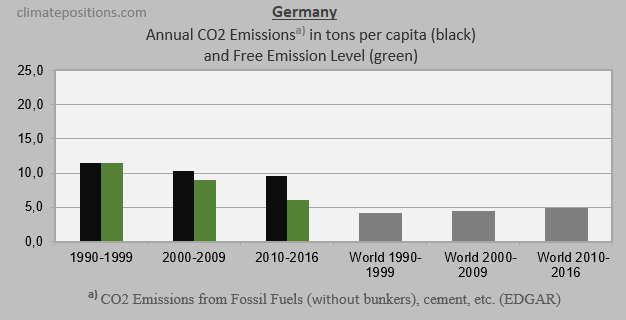
The next three diagrams show Fossil CO2 Emissions from fuels and industrial processes¹, in tons per capita in decades, of South Korea, Australia and Germany. The green bars show the Free Emission Level² – the exceedance is the basis for calculating the national Climate Debt. The grey bars are World emissions average.
CO2 Emissions data 1990-2016 (EDGAR) has been updated October 2017.
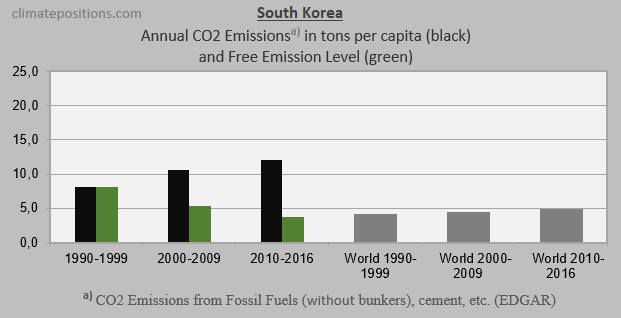
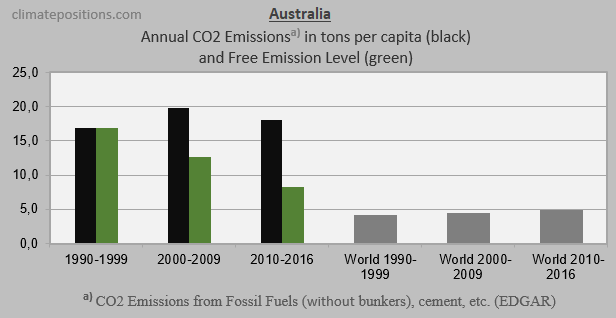
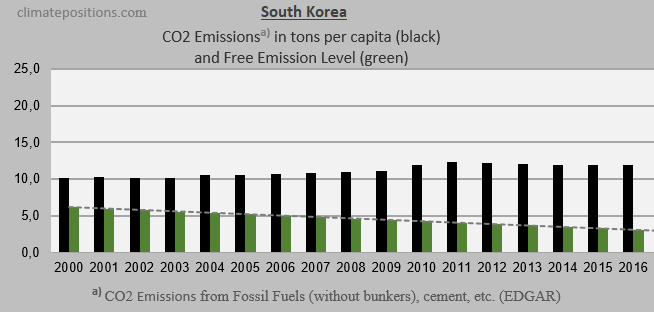
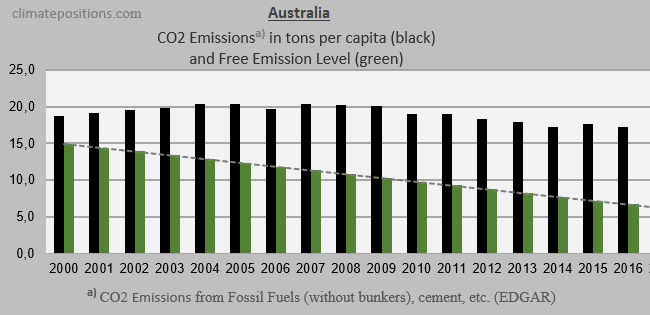
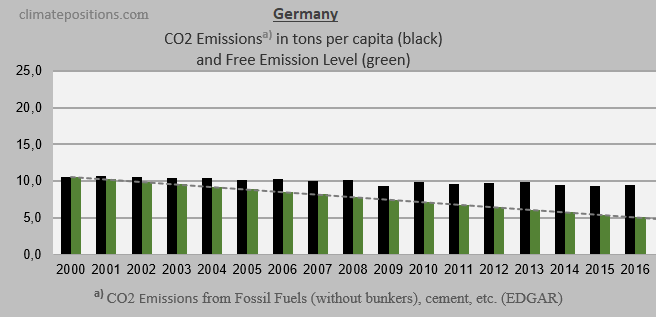
The three diagrams below show the per capita Fossil CO2 Emissions from fuels and industrial processes¹, annually since 2000, of the three countries. The green bars show the Free Emission Level². The performances of South Korea and Australia are disgraceful, whereas Germany’s reduction-rate is too small.
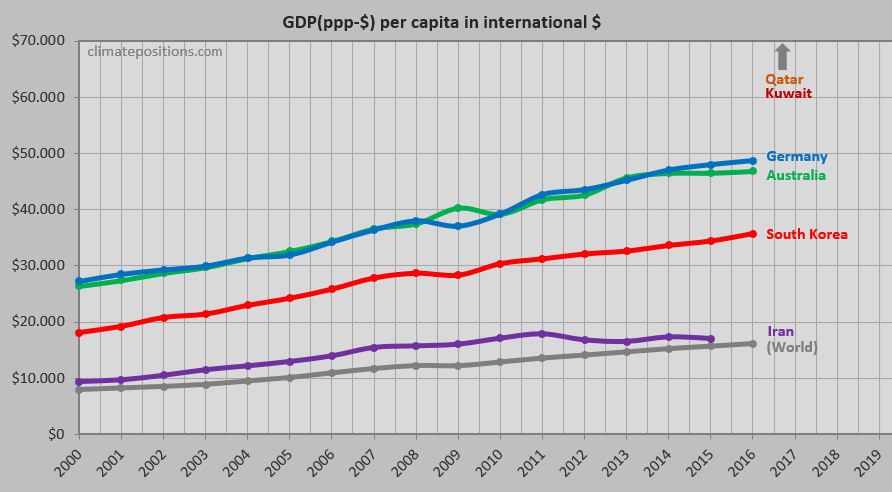
The diagram below shows per capita GDP(ppp-$) of the same countries (Qatar burst the scale once again!) and the World average. The wealth of Germany and South Korea are around 3 times greater than World average.
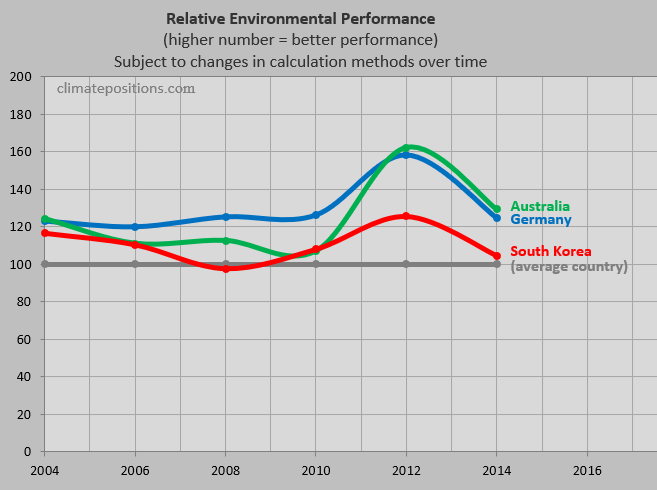
The next diagram shows the relative Environmental Performance of South Korea, Australia and Germany, with an average country set at 100. All three peaked around 2012 (approximate data year), relatively. [Added 25-1-2018: See the new ‘Environmental Performance Index 2018‘]
The average per capita Ecological Footprint without carbon, between 2000 and 2013, with an average World country set at 100, of South Korea, Australia and Germany are 107, 273 and 137, respectively. Release years are about four years after data years. Australia’s Climate Debt would have been 6.4% smaller with World average footprint. Note that footprint calculation methods have changed over time. The latest and historic details from the source are available here: ‘South Korea‘, ‘Australia‘ and ‘Germany‘.
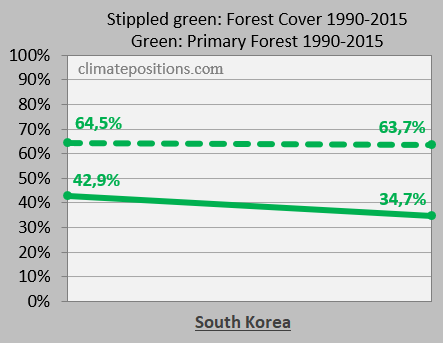
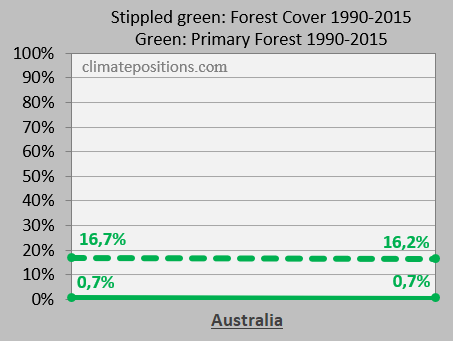
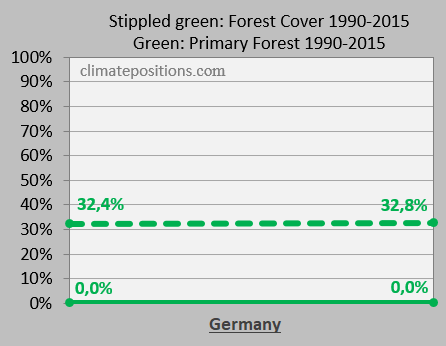
Forest Cover and the precious Primary Forests as percentage of total land area, in 1990 and 2015, are important indicators in ClimatePositions. The South Korean decrease in Primary Forests since 1990 is responsible for 8% of its Climate Debt. Australia’s and Germany’s priorities of the precious Primary Forests speak for themselves.
The per capita Nuclear Power generation 2000-2016 of South Korea and Germany are shown below (the per capita ranking is shown in bracket), compared to the 2nd ranked France. South Korea is the World’s 5th largest Nuclear Power generator, while Germany ranks 8th (ranked 4th in 2006). In the calculation of Climate Debt, Nuclear Power must be phased out similar to Fossil Fuels, calculated as if Nuclear Power was oil-generated.
![]()
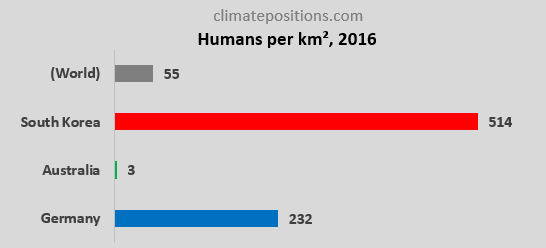
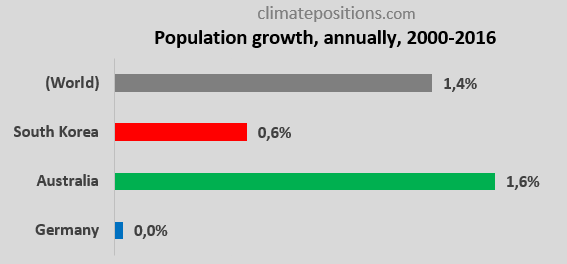
The diagrams below show Population density 2016 and growth between 2000 and 2016. Among countries with more than 5 million people South Korea ranks 4th on population density (after Hong Kong, Bangladesh and Taiwan). The Populations of South Korea, Australia and Germany are about 51, 24 and 83 million, respectively.
Finally, the table below shows four key values of South Korea, Australia, Germany, Qatar, Kuwait and Iran in the calculation of national Climate Debts in ClimatePositions. The price of CO2 per ton (column two) is for total CO2 Emission from Fossil Fuels (without bunkers) and industrial processes. Climate change financing (column three) is from July 2017.
| . | Tons of CO2 | Price per | Climate change | Financing as |
| . | exceeded since | ton CO2 | financing | share of |
| . | 2000, per capita | since 2000 | per capita | Climate Debt |
| . | . | . | . | . |
| South Korea | 111.13 | $26.83 | $1.00 | 0.02% |
| Australia | 140.66 | $26.81 | $18.73 | 0.22% |
| Germany | 36.93 | $13.64 | $36.34 | 1.59% |
| Qatar | 345.23 | $79.04 | $0.00 | 0.00% |
| Kuwait | 256.42 | $58.65 | $0.00 | 0.00% |
| Iran | 60.47 | $12.00 | $0.00 | 0.00% |
.
¹Fossil CO2 Emissions include all anthropogenic emissions from Fossil Fuel (combustion and production) and from industrial processes (cement, steel, liming, urea and ammonia production or consumption). The uncertainty in Fossil CO2 emissions is below 5% for industrialized countries and below 15% for developing countries.CO2 Emissions from international shipping and aviation (bunkers) are not included.
²The Free Emission Level (green bars) is determined by national CO2 Emissions 1990-1999 (base), and 11 more ‘Indicators‘, of which 7 are national and 4 are global.
.
Updated data and diagrams of all ‘Indicators‘ and all countries in ClimatePositions are available in the menu ‘Calculations (Excel)’.
Data on Fossil CO2 Emissions (excluding international shipping and aviation) and industrial processes (cement, steel, liming, etc.) are from EDGAR (European Commission) (links in the menu Calculations / Sources & Links).
Information on national GDP(ppp-$) per capita: Worldbank (links in the menu Calculations / Sources & Links).
Source on Environmental Performance: Yale and Columbia University (links in the menu Calculations / Sources & Links).
Source on Ecological Footprint: Global Footprint Network (links in the menu Calculations / Sources & Links).
Data on national Forest Cover and Primary Forests are from United Nations UN (Report: Global Forest Resources Assessments) (links in the menu Calculations / Sources & Links).
Data on national Nuclear Power generation: World Nuclear Association (links in the menu Calculations / Sources & Links).
Data on national and global Populations is from Worldbank (links in the menu Calculations / Sources & Links).
PowerPoint collage with flags by Claus Andersen, 2017.
Comments are closed.