Is Singapore a climate change scoundrel?

2013
The island of Singapore was the 2nd worst performing country in ClimatePositions 2010 with a contribution (climate debt) of $9,924 per capita and there are no signs of improvement since. In the updated calculation the amount has increased to $12,364. The diagram shows the small hybrid regime’s outrageous annual CO2 Emissions (the green bars show the Contribution Free Level). Note that a large proportion of the emissions is due to marine bunkers.
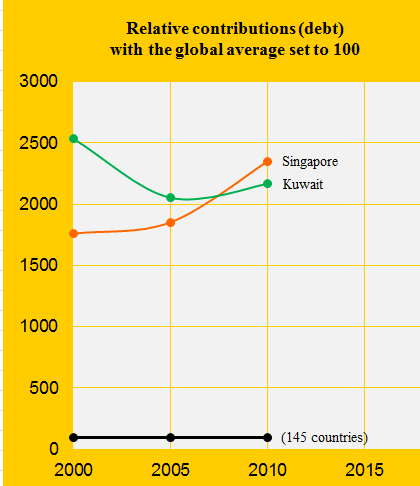
Between 2005 and 2010 Singapore took over the 2nd place from the authoritarian regime Kuwait on the list of the world’s worst performing countries (see the full country list in the menu “Contributions/Per Capita US$ Rank”). The diagram below shows the two climate change scoundrel countries’ relative Contributions per capita 2000-2010, with the global average set at 100 (the black line).
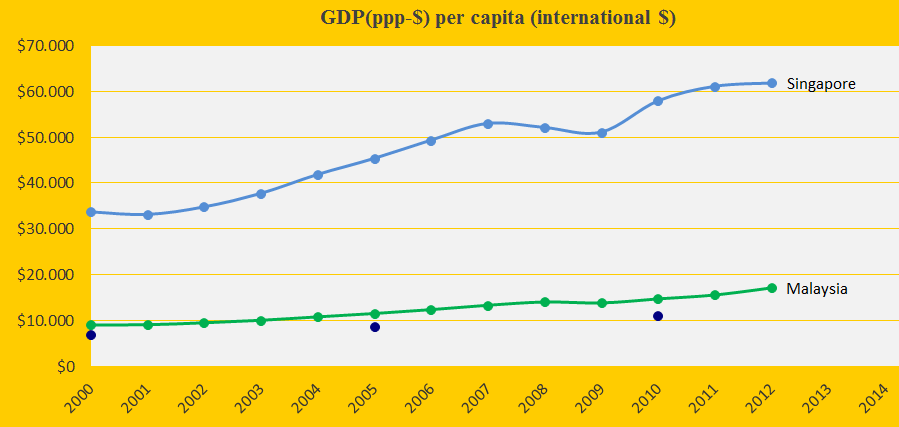
Singapore is one of the richest countries in the world. The end diagram shows the annual GDP(ppp-$) in comparison with the neighboring country Malaysia and the global average (the blue dots).
Source on CO2 emissions: EIA, U.S. Energy Information Administration (links in the menu “Calculations”).
Information on national GDP(ppp-$) per capita is from Worldbank (links in the menu “Calculations”). Read about GDP+ in the submenu ”Indicators”.
Democratic Index is from Wikipedia (links in the menu “Calculations”).
Comments are closed.

