Brazil’s rainforests and climate change performance

2014
The Google map of the Amazon is from the new interactive ‘Global Forest Change‘ developed by The University of Maryland (read ‘more’). The red is Forest Loss from 2000 to 2012, the blue is Forest Gain and the green is Forest Extent (unchanged). The purple is areas of mixed Forest Loss and Forest Gain. According to Brazil’s environment minister the lowest recorded deforestation of Brazil since 1988, was in 2012. Furthermore, up to a third of the cleared rainforest over the past decades may be on the way back (regrowth).
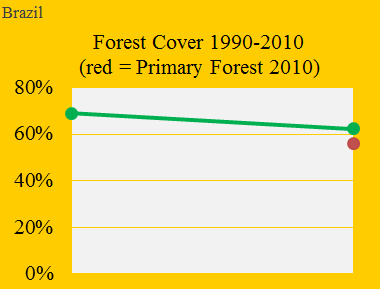
The latest forest trends are not yet reflected in the ClimatePosition calculations. The diagram below shows the change in the Brazilian Forest Cover from 1990 to 2010 (7% reduction in twenty years) and the share of the precious Primary Forests (the red dot) in 2010. The latter was reduced from 59% of the total land area in 2000 to 56% in 2010 (3% reduction in ten years).
The Amazon represents more than half of the world’s remaining rainforests and is shared between nine countries: Brazil (60%), Peru (13%), Colombia (10%), Venezuela, Ecuador, Bolivia, Guyana, Suriname and French Guiana. The three latter are missing indicator data in ClimatePositions but with reasonable estimates¹ entered the calculations the climate debt of the nine countries are as follows (with the global ‘ranking’):
—————————————————————-
| . | Climate Contributions | |
| . | per capita (opdated) | |
| . | . | . |
| 42. | Venezuela | $671 |
| Suriname | $260¹ | |
| 64. | Brazil | $140 |
| 69. | Ecuador | $79 |
| French Guiana | $75¹ | |
| Guyana | $71¹ | |
| 80. | Bolivia | $16 |
| Colombia | Free | |
| Peru | Free | |
—————————————————————-
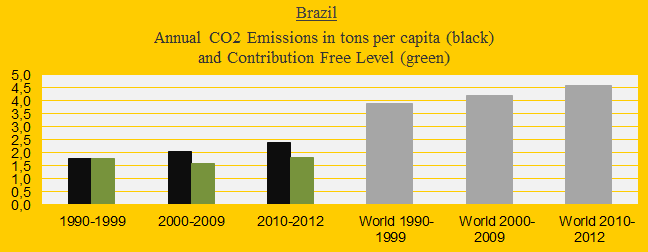
The diagram below shows the Brazilian CO2 Emissions per capita in decades. The green bars are the Contribution Free Level (determined by the national CO2 Emission level in the 1990s and eleven updated ‘indicator’ values) and the gray bars are world average.
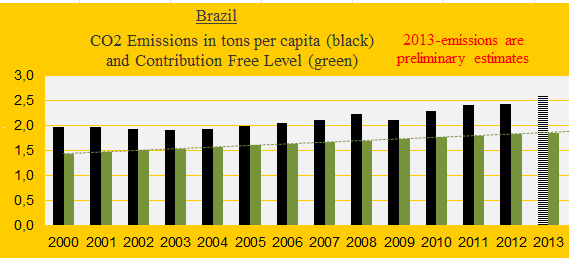
The next diagram shows Brazil’s CO2 Emissions per capita annually since 2000. The green dashed line shows the Contribution Free Level. In 2012 Brazil emitted 1.6% of the global CO2 Emissions from fossil fuels.
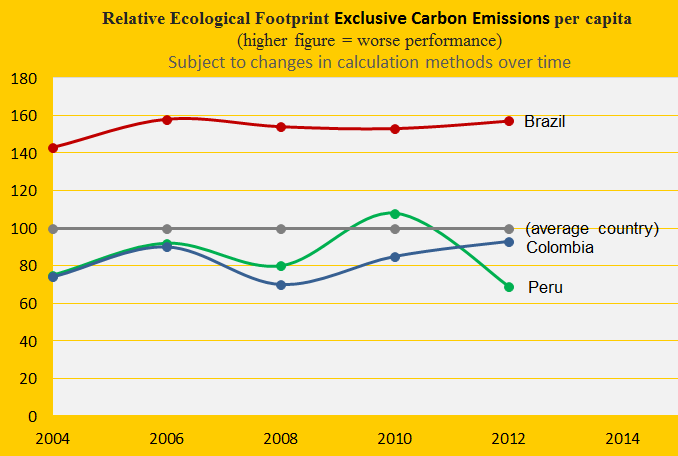
The Ecological Footprint per capita (without carbon emissions) of Brazil, Peru and Colombia, in comparison with an average country, is shown in the diagram below. The two latter have considerably smaller footprints than Brazil, besides being Contribution Free.
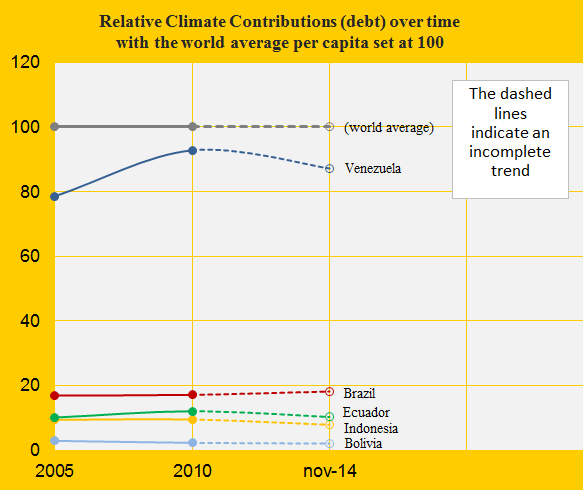
The diagram below shows Brazil’s relative Climate Contribution (debt) in comparison with Bolivia, Venezuela, Ecuador and Indonesia, with the world average set at 100. Brazil’s increase rate of climate debt is close to the world trend, though at a lower level.
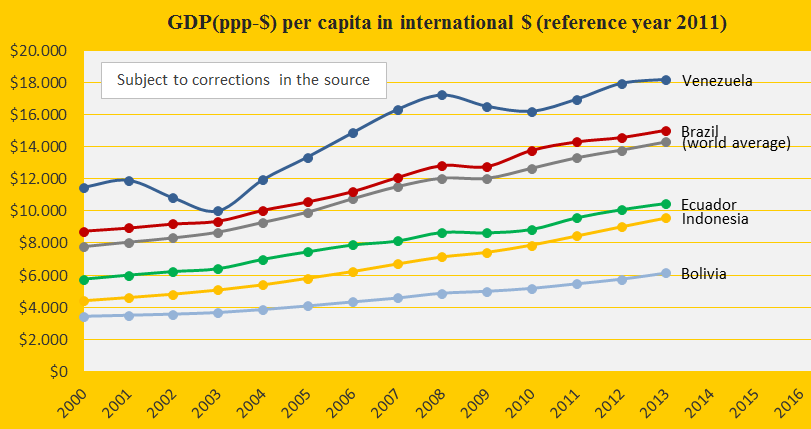
The Brazilian GDP(ppp-$) per capita is close to the world average – see the diagram below with Bolivia, Venezuela, Ecuador and Indonesia.
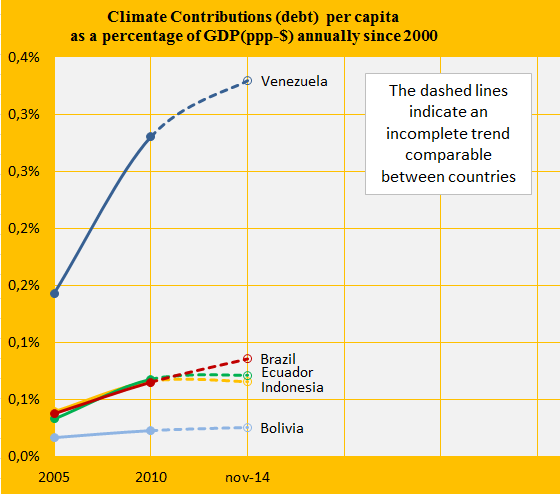
The accumulated Climate Contribution (debt) calculated as shares of the GDP(ppp-$) annually since 2000 is shown below. Since 2010 Ecuador and Indonesia has passed Brazil’s performance (preliminary estimates). The performance of Venezuela is very poor and Bolivia is not far from the Contribution Free Level.
.
¹Indicator estimates: Guyana (Ecological Footprint without carbon emissions is set at the Bolivian level), Suriname (Ecological Footprint without carbon emissions is set at the Brazilian level) and French Guiana (Ecological Footprint without carbon emissions and Environmental Performance are both set at the Bolivian level).
Hypothetical example no. 1: If Brazil had retained the area of Primary Forest since 2000, then the climate debt would have been $123 per capita instead of $140 – if the Forest Cover furthermore had been retained since 1990, then the climate debt would have been $85.
Hypothetical example no. 2: If Brazil had emitted 9% less carbon dioxide from fossil fuels 2000-2013, then the climate debt would have been $85 per capita instead of $140.
Source on Ecological Footprint: WWF reports “The Living Planet” published 2006-2014 (links in the menu “Calculations”).
Information on national GDP(ppp-$) per capita: Worldbank (links in the menu “Calculations”).
Source on CO2 Emissions: EIA, U.S. Energy Information Administration and data on preliminary national CO2 Emissions are from Global Carbon Project (links in the menu “Calculations”).
Sources on national forest cover and primary forests: United Nations (UN) (links in the menu “Calculations”).
Article about the latest develepment in the Amazons: ‘The Guardian‘.
Detailed information on Brazil’s rainforests: ‘mongabay.com‘.
First image is from ‘Global Forest Change‘ developed by The University of Maryland (the writing and dashed line are by Claus Andersen), 2014.
Comments are closed.