Global warming: China in its own CO2 Emission league
2013
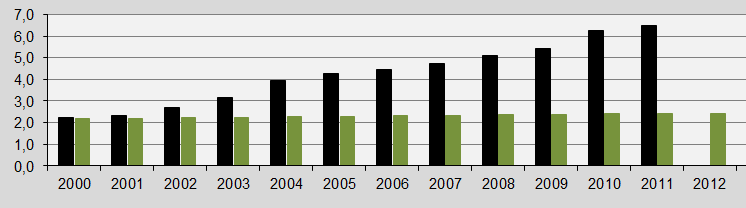
Global warming is caused mainly by human CO2 Emissions.The diagram above shows China’s annual CO2 Emissions (carbon dioxide) in tons per capita 2000-2011 (the black bars). The green bars show the Contribution Free Levels in ClimatePositions. The free level of CO2 Emissions is dependent on various indicators (see the menu “Calculations/Indicators”). China was the 57th worst performing country out of 145, in terms of Contribution (climate debt) per capita. The total national Contribution increased from 26 billion US$ in 2005 to 185 billion in 2010. This explosive negative development is outstanding in the world and China is now by far the largest CO2 Emitter.
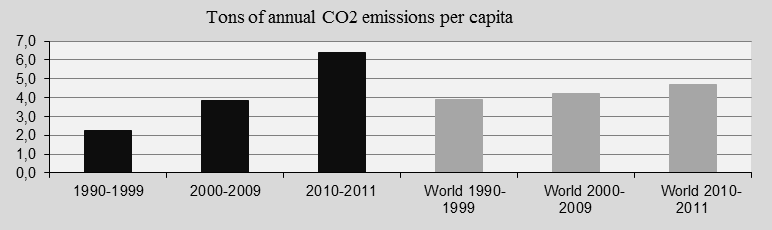
The diagram below show China’s (the black bars) and the world’s average CO2 Emissions in tons per capita in decades since 1990. China passed the global average in 2007.
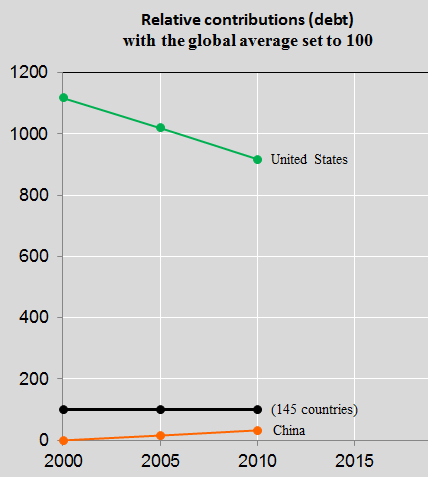
The deadlocked negotiating position between the world’s leaders can be illustrated by a comparison of China and United States. The diagram below show the two countries’ Climate Contributions per capita (climate debt) in 2000, 2005 and 2010, with the global average set at 100. China’s share of the global Contribution has in other words increased from a low level (3.2% in 2005 to 6.5% in 2010) and United States’ share has decreased from an exstremely high level (47.4% in 2005 to 42.5% in 2010). United States behave as if the destabilization of the planet’s climate must be Contribution Free for “God’s own country” and China claims to be a developing country with the right to a huge destructive CO2 margin.
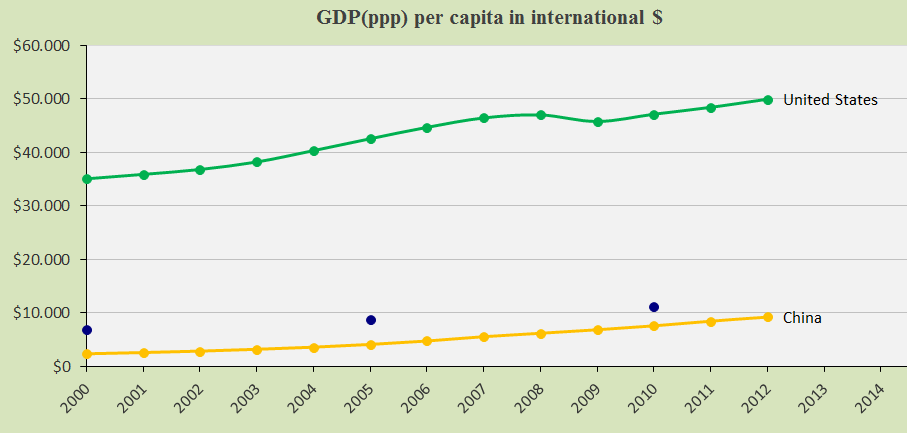
The diagram below show the gap between China and United States’ GDP(ppp-$) per capita in 2000-2012 (subject to modifications in the data source). China is slowly approaching the global average (the black line). United States has become very rich by burning oil, gas and coal for decades at the expense of the rest of the world and future generations.
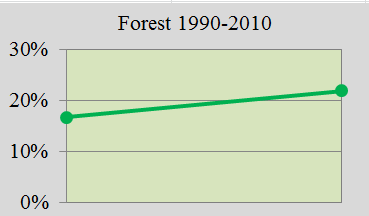
China had a forest cover of 16.7% in 1990 and 21.9% in 2010 (see the diagram below). The increase gave a national saving of 20 billion US$ in ClimatePositions in 2010.
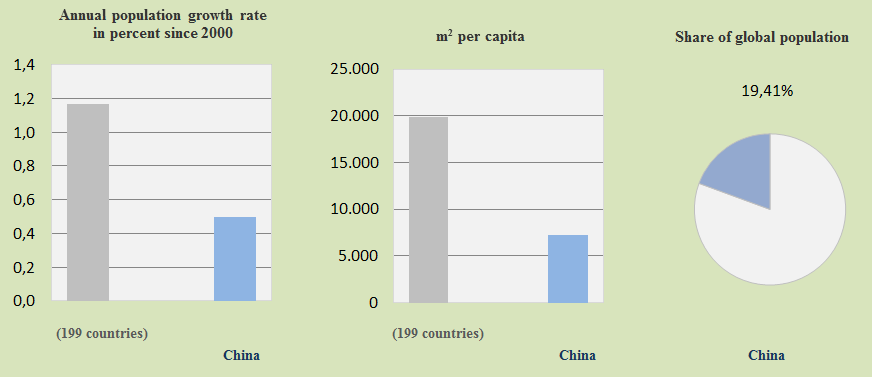
The diagrams below show Population trends in China compared with the world. The previous high Population growth rate in China has slowed down and was in 2000-2010 far below the world average. A Chinese has an average of 7,216 m² which is far less than the world average.
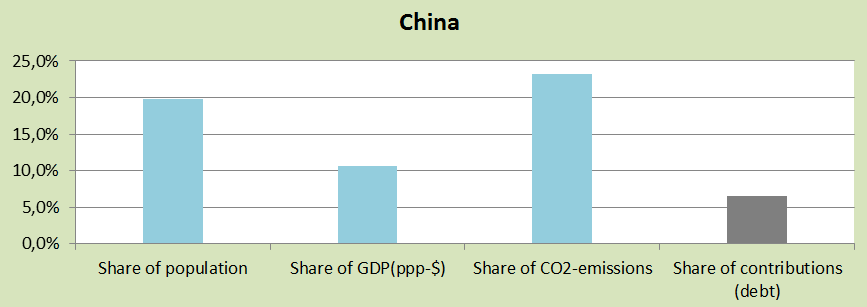
The last diagram (below) summarizes China’s position on climate change. The authoritarian regime has almost one in five human being on earth but the GDP(ppp-$) is close to half this share. The share of CO2 Emissions (in 2006-2010) is relatively high and the share of the global Contribution is relatively low. The last two columns are increasing dramatically these years.
Source on CO2 emissions: EIA, U.S. Energy Information Administration (links in the menu “Calculations”).
Data sources on national forest area are from the United Nations (UN)(links in the menu “Calculations”).
Information on national GDP(ppp-$) per capita is from Worldbank (links in the menu “Calculations”). Read about GDP+ in the submenu ”Indicators”.
Data on national and global populations are from the EIA, U.S. Energy Information Administration. Global population before 1980 is from United Nations (UN) (links in the menu “Calculations”).
Comments are closed.