Climate change performance: Brazil vs. Mexico
2017
Brazil and Mexico are the world’s 11th and 12th largest emitters of CO2 from Fossil Fuels and cement. Combined, the two countries were responsible for 2.8% of world CO2 Emissions in 2015. The following examines the ‘Indicators‘ of CO2 Emissions, GDP(ppp-$), Forest Cover, Primary Forest and Ecological Footprint (without carbon footprint).
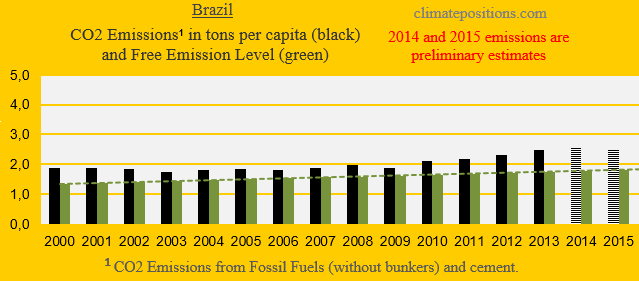
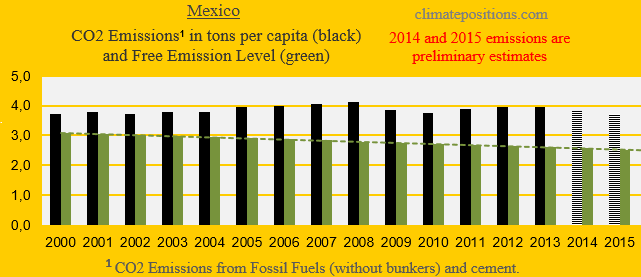
The diagrams below show the per capita CO2 Emissions from Fossil Fuel (without bunkers) and cement, since 2000. The green bars show the Free Emission Level¹ – the exceedance is the basis for calculating the national Climate Debt.
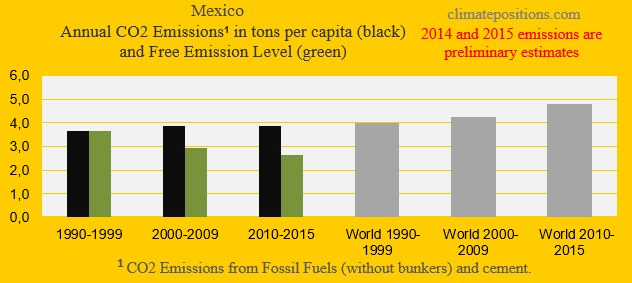
The next two diagrams show Brazil’s and Mexico’s CO2 Emissions in tons per capita, in decades. Brazil can increase emissions by nearly 22% in 2020, compared to 1990s, while Mexico must reduce by 35%. The grey bars are world emissions average.

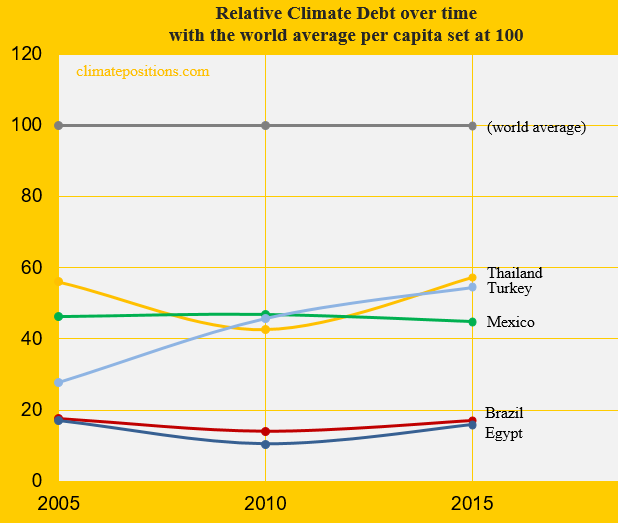
The diagram below shows the relative per capita Climate Debt of Brazil and Mexico, in comparison with Thailand, Turkey and Egypt – with the world’s average Climate Debt set at 100. The current Brazilian per capita Climate Debt is $149 and the one of Mexico is $365 (see the latest ‘Ranking‘).
[Some figures in this article were corrected 22/5 2017]
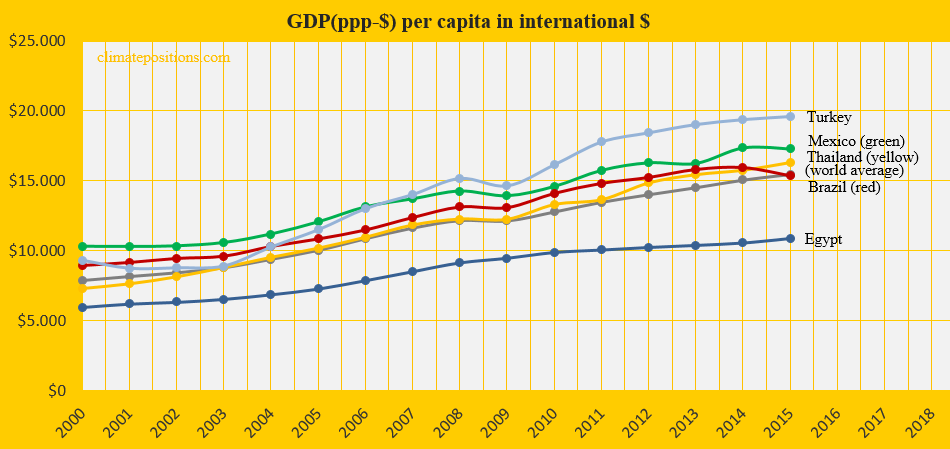
The diagram below shows the per capita GDP(ppp-$) of the same five countries and the world average. The wealth of Brazil and Mexico both dropped in 2015, compared to 2014.
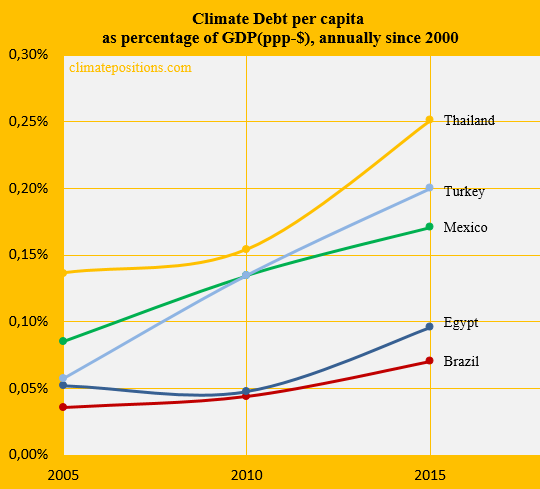
The next diagram (below) shows Climate Debt of the five countries calculated as percentage of GDP(ppp-$), annually since 2000. See the updated ‘Ranking‘.
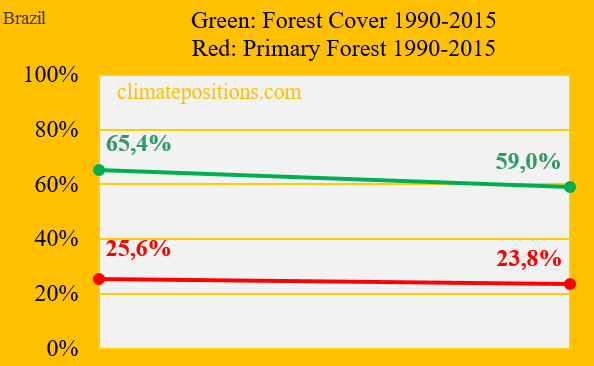
The two diagrams below show the changes in Forest Cover and Primary Forests, from 1990 to 2015, of Brazil and Mexico. Between 2010 and 2015, the precious Brazilian Primary Forests remained unchanged, while the Mexican decreased by 0.34%.

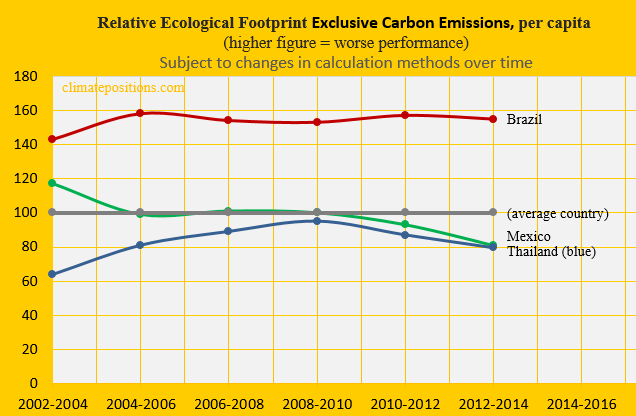
The Ecological Footprint per capita (without carbon footprint) of Brazil, Mexico and Thailand, in comparison with an average country (set at 100), is shown in the last diagram.
Finally, the table below shows four key values of the five countries, in the calculation of national Climate Debts in ClimatePositions. The price of CO2 per ton (column two) is for the total CO2 Emission from Fossil Fuels (without bunkers) and cement. Climate change financing (column three) is from June 2016.
| . | Tons of CO2 | Price per | Climate change | Financing as |
| . | exceeded since | ton CO2 | financing | share of |
| . | 2000, per capita | since 2000 | per capita | Climate Debt |
| . | . | . | . | . |
| Brazil | 7.44 | $4.57 | $0.03 | 0.02% |
| Mexico | 16.84 | $5.90 | $0.16 | 0.04% |
| Thailand | 24.76 | $7.67 | $0.00 | 0.00% |
| Turkey | 20.08 | $7.67 | $0.03 | 0.01% |
| Egypt | 8.92 | $3.34 | $0.00 | 0.00% |
¹The Free Emission Level (green bars) is determined by national CO2 Emissions 1990-1999 (baseline), and 11 more ‘Indicators‘, of which 7 are national and 4 are global.
..
Updated data and diagrams of all ‘Indicators’ and all countries in ClimatePositions are available in the menu ‘Calculations (Excel)‘.
Data on carbon emissions (CO2 Emissions) from fossil fuels (without bunkers) and cement production are from Global Carbon Project (CDIAC); (links in the menu “Calculations”).
Information on national GDP(ppp-$) per capita: Worldbank (links in the menu “Calculations”).
Sources on national Forest Cover and Primary Forests: United Nations (UN) (Report: Global Forest Resources Assessments) (links in the menu “Calculations”).
Source on Ecological Footprint: Global Footprint Network (links in the menu “Calculations”).
Drawing by Claus Andersen, 2017.
Comments are closed.