Climate change performance: Canada vs. South Africa

2017
Canada and South Africa are the world’s 13th and 14th largest emitters of CO2 from Fossil Fuels and cement. Combined, the two countries were responsible for 2.6% of world CO2 Emissions in 2015. The following examines the ‘Indicators‘ of CO2 Emissions, GDP(ppp-$), Ecological Footprint and Nuclear Power.
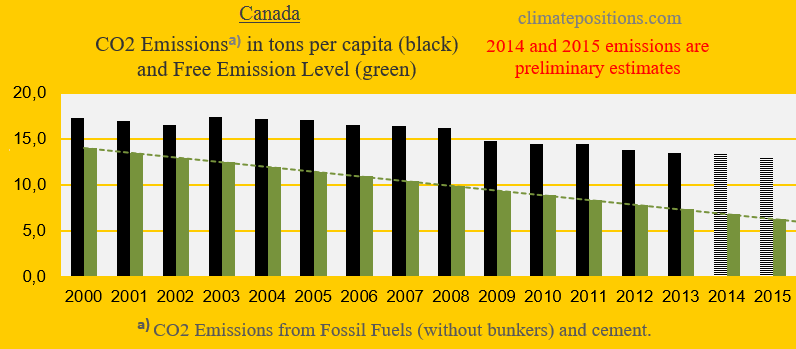
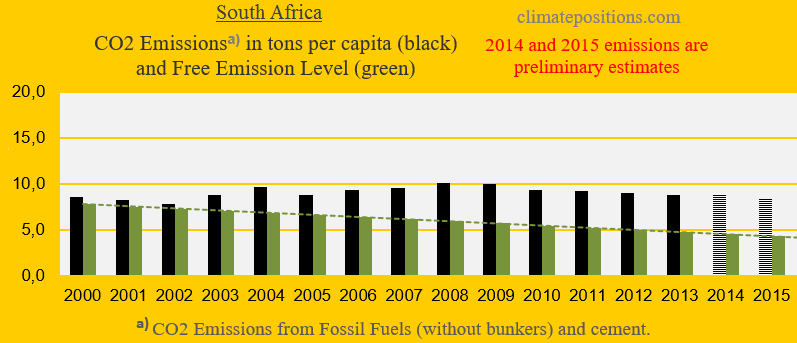
The diagrams below show the per capita CO2 Emissions from Fossil Fuel (without bunkers) and cement, since 2000. The green bars show the Free Emission Level¹ – the exceedance is the basis for calculating the national Climate Debt. Canada’s emissions from coal decreased by 41.3% between 2000 and 2014 (coal caused 13% of the CO2 Emissions from Fossil Fuels in 2014). South Africa’s emissions from coal increased by 6.4% between 2010 and 2014 (coal caused 83% of the CO2 Emissions from Fossil Fuels in 2014).
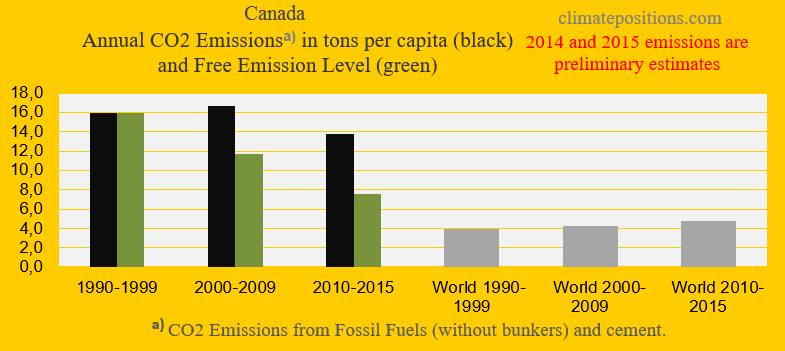
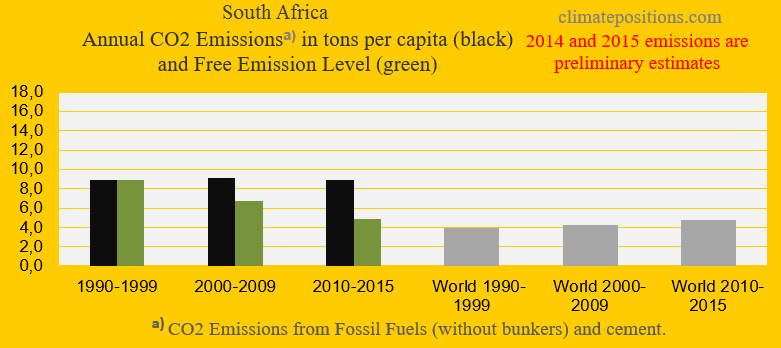
The next two diagrams show Canada’s and South Africa’s CO2 Emissions in tons per capita, in decades. Canada must reduce emissions by 73% in 2020, compared to 1990s, while South Africa must reduce by 62%. The grey bars are world emissions average.
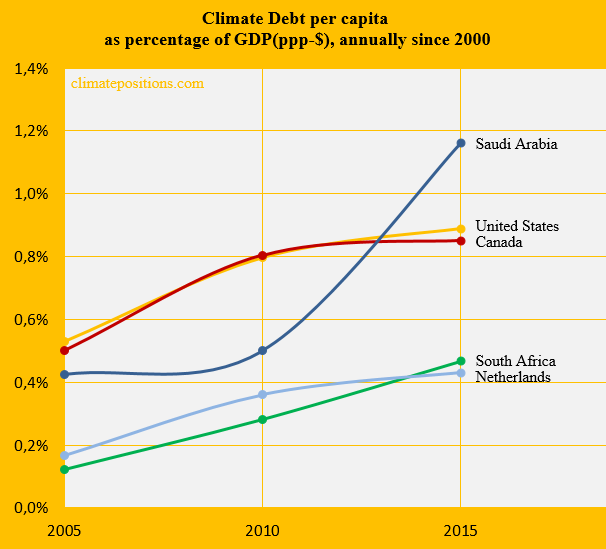
The diagram below shows the relative per capita Climate Debt of Canada and South Africa, in comparison with the United States, Saudi Arabia and Netherlands – with the world’s average Climate Debt set at 100. The current Canadian per capita Climate Debt is $5,049 and the South African is $818 (see the latest ‘Ranking‘).
[Some figures in this article were corrected 22/5 2017]

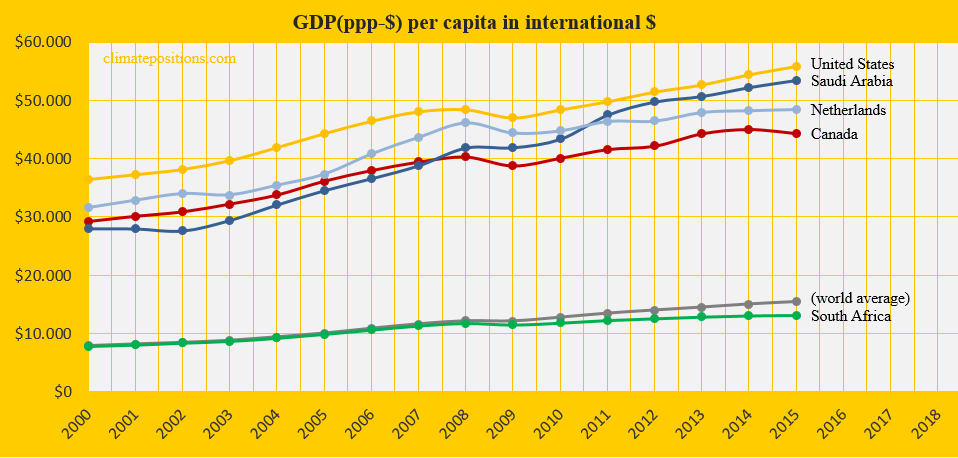
The diagram below shows the per capita GDP(ppp-$) of the same five countries and the world average. The economy of Canada slowed down in 2015.
The next diagram (below) shows Climate Debt of the five countries calculated as percentage of GDP(ppp-$), annually since 2000. See the updated ‘Ranking‘.
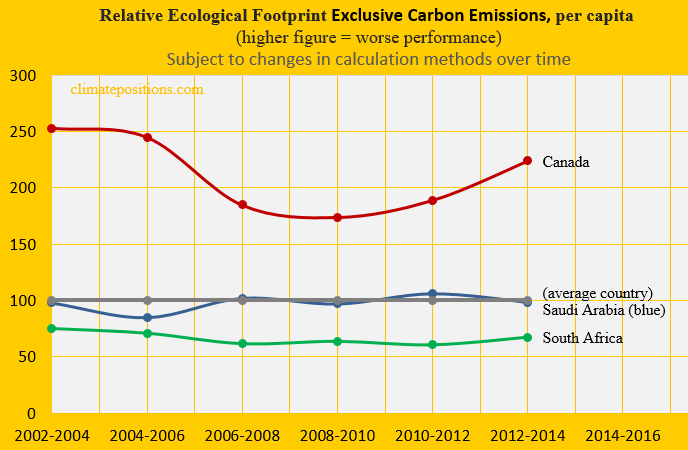
The Ecological Footprint per capita (without carbon footprint) of Canada, South Africa and Saudi Africa, in comparison with an average country (set at 100), is shown below. Canada ranks 7th among 172 countries
The per capita Nuclear Power generation 2000-2015 is shown below. Canada was the world’s 6th largest Nuclear Power generator in 2015, while South Africa ranked 23rd. In the calculation of Climate Debt, Nuclear Power must be phased out similar to Fossil Fuels (calculated as if Nuclear Power is oil-generated).
![]()
Finally, the table below shows four key values of the five countries, in the calculation of national Climate Debts in ClimatePositions. The price of CO2 per ton (column two) is for total CO2 Emission from Fossil Fuels (without bunkers) and cement. Climate change financing (column three) is from March 2017.
| . | Tons of CO2 | Price per | Climate change | Financing as |
| . | exceeded since | ton CO2 | financing | share of |
| . | 2000, per capita | since 2000 | per capita | Climate Debt |
| . | . | . | . | . |
| Canada | 86.55 | $20.35 | $23.99 | 0.48% |
| South Africa | 47.89 | $5.66 | $0.09 | 0.01% |
| United States | 93.32 | $22.82 | $17.53 | 0.26% |
| Saudi Arabia | 119.74 | $39.44 | $0.00 | 0.00% |
| Netherlands | 45.80 | $17.80 | $25.39 | 0.87% |
.
¹The Free Emission Level (green bars) is determined by national CO2 Emissions 1990-1999 (baseline), and eleven more ‘Indicators‘, of which seven are national and four are global.
.
Updated data and diagrams of all ‘Indicators‘ and all countries in ClimatePositions are available in the menu ‘Calculations (Excel)‘.
Data on carbon emissions (CO2 Emissions) from fossil fuels (without bunkers) and cement production are from Global Carbon Project (CDIAC); (links in the menu “Calculations / Sources and Links”).
Data on energy CO2 Emissions from Coal, Oil and Gas are from ‘http://www.iea.org/publications/‘ (CO2 Highlights, Excel).
Information on national GDP(ppp-$) per capita: Worldbank (links in the menu “Calculations / Sources and Links”).
Source on Ecological Footprint: Global Footprint Network (links in the menu “Calculations / Sources and Links”).
Data on national Nuclear Power generation: World Nuclear Association (links in the menu “Calculations / Sources and Links”).
Drawing by Claus Andersen, 2017.
Comments are closed.