Climate change performance: Egypt vs. Ukraine

Egypt and Ukraine are the world’s 25th and 26th largest emitters of CO2 from Fossil Fuels and cement. Combined, the two countries were responsible for 1.2% of global CO2 Emissions in 2015. The following examines the ‘Indicators‘ of CO2 Emissions, GDP(ppp-$), Ecological Footprint and the Ukrainian Nuclear Power.
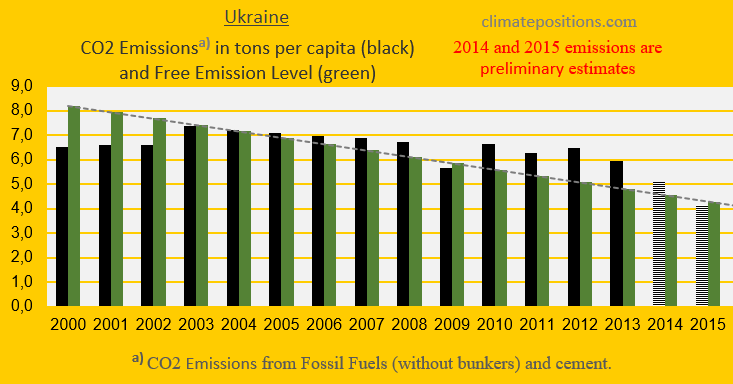
The diagrams below show the per capita CO2 Emissions from Fossil Fuel (without bunkers) and cement, since 2000. The green bars show the Free Emission Level¹ – the exceedance is the basis for calculating the national Climate Debt. 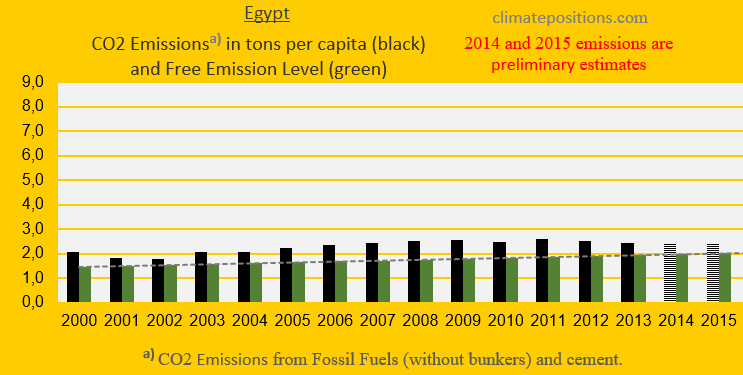
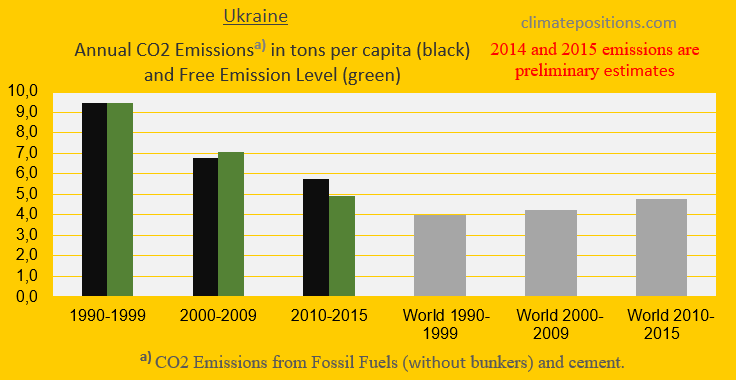
The next two diagrams show Egypt’s and Ukraine’s CO2 Emissions in tons per capita, in decades. Egypt can increase emissions by 39.0% in 2020, compared to 1990s, while Ukraine must reduce emissions by 65.7%. The grey bars are world emissions average.

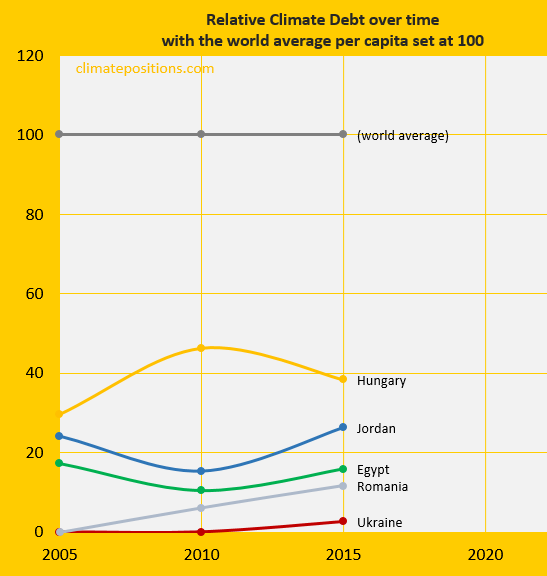
The diagram below shows the relative per capita Climate Debt of Egypt and Ukraine, in comparison with Hungary, Romania and Jordan – with the world’s average Climate Debt set at 100. The current per capita Climate Debt of Egypt is $122, and the Ukrainian is $25 (see the latest ‘Ranking‘).
[Some figures in this article were corrected 22/5 2017]
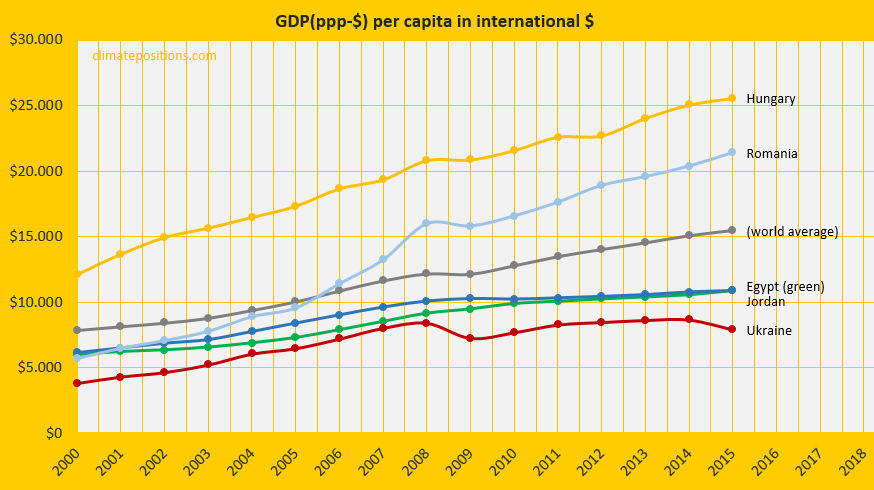
The diagram below shows the per capita GDP(ppp-$) of the same five countries and the world average. The Egyptian per capita wealth was world average in 2015, while the Ukrainian economy has been suffering from a severe decline since 2013 due to the loss of its largest trading partner, Russia, over the annexation of Crimea (‘Wikipedia‘).
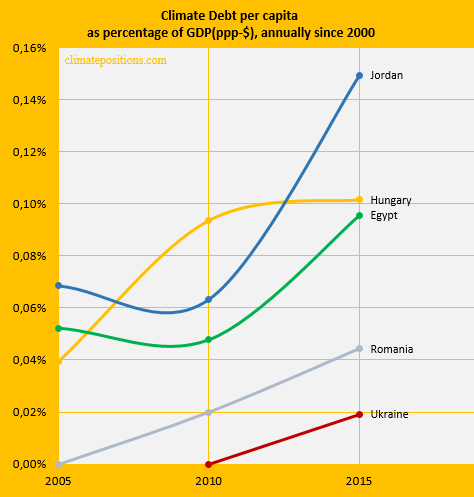
The next diagram shows Climate Debt of the five countries calculated as percentage of GDP(ppp-$), annually since 2000. See the updated ‘Ranking‘.
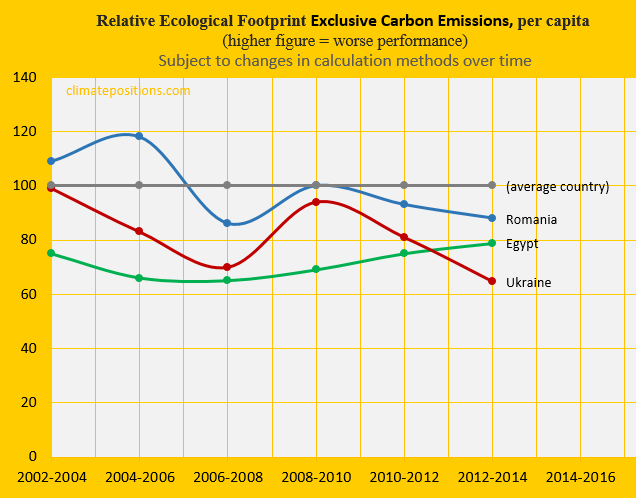
The Ecological Footprint per capita, without the carbon footprint, of Egypt, Ukraine and Romania, in comparison with an average country (set at 100), is shown below. Egypt ranked 106th among 172 countries in 2012-2014 (publishing year 2016), while Ukraine ranked 132nd.
The per capita Nuclear Power generation 2000-2015, of Ukraine and Hungary, is shown below. Egypt has no Nuclear Power. In the calculation of Climate Debt, Nuclear Power must be phased out similar to Fossil Fuels, calculated as if Nuclear Power was oil-generated. The Ukrainian Climate Debt would have been only 39% of the current if the per capita Nuclear Power generation had remained at the lower level in 1990s.
![]()
Finally, the table below shows four key values of the five countries, in the calculation of national Climate Debts in ClimatePositions. The price of CO2 per ton (column two) is for total CO2 Emission from Fossil Fuels (without bunkers) and cement. Climate change financing (column three) is from March 2017.
| . | Tons of CO2 | Price per | Climate change | Financing as |
| . | exceeded since | ton CO2 | financing | share of |
| . | 2000, per capita | since 2000 | per capita | Climate Debt |
| . | . | . | . | . |
| Ukraine | 2.25 | $0.25 | $0.00 | 0.00% |
| Egypt | 8.92 | $3.34 | $0.00 | 0.00% |
| Hungary | 10.16 | $3.86 | $0.61 | 0.19% |
| Jordan | 14.96 | $3.70 | $0.00 | 0.00% |
| Romania | 4.21 | $1.49 | $0.00 | 0.00% |
.
¹The Free Emission Level (green bars) is determined by national CO2 Emissions 1990-1999 (baseline), and 11 additional ‘Indicators‘, of which 7 are national and 4 are global.
.
Updated data and diagrams of all ‘Indicators’ and all countries in ClimatePositions are available in the menu ‘Calculations (Excel)‘.
Information on national GDP(ppp-$) per capita: Worldbank (links in the menu Calculations / Sources & Links).
Data on carbon emissions (CO2 Emissions) from fossil fuels (without bunkers) and cement production are from Global Carbon Project (CDIAC); (links in the menu Calculations / Sources & Links).
Source on Ecological Footprint: Global Footprint Network (links in the menu Calculations / Sources & Links).
Data on national Nuclear Power generation: World Nuclear Association (links in the menu Calculations / Sources & Links).
Drawing by Claus Andersen, 2017.
Comments are closed.