Climate change performance: India vs. Russia (CO2 Emissions from coal)
2016
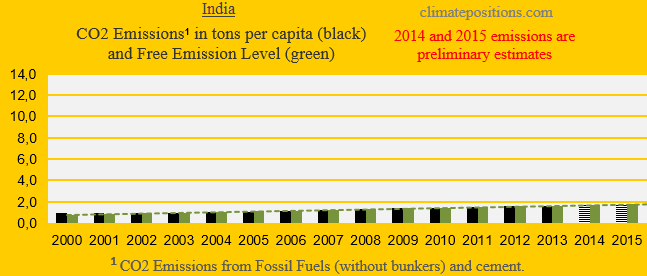
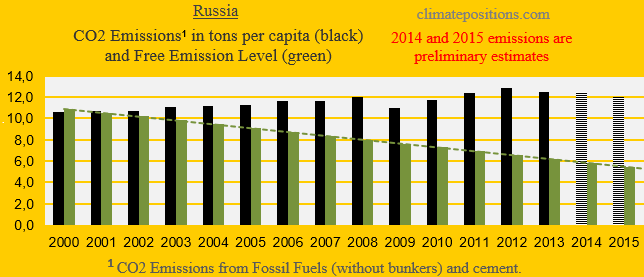
The diagrams below show the per capita CO2 Emissions from Fossil Fuel (without bunkers) and cement, annually since 2000, of India and Russia. The green bars show the Free Emission Level¹ – the exceedance is the basis for calculating the national Climate Debt. The world’s 3rd and 4th largest CO2-emitters were responsible for 6.5% (India) and 4.9% (Russia) of global emissions in 2015. India’s per capita emissions were 1.7 tons in 2015 (preliminary), which was 4.0% above the 2014-level.
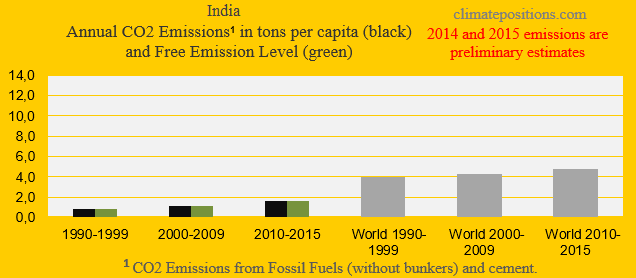
The next two diagrams show India’s and Russia’s CO2 Emissions in tons per capita, in decades. The grey bars are world emissions average. The green bars show the Free Emission Level¹ – compared to the emission level in the 1990s, India can increase emissions by around 140% by 2020, while Russia must decrease by around 67%.

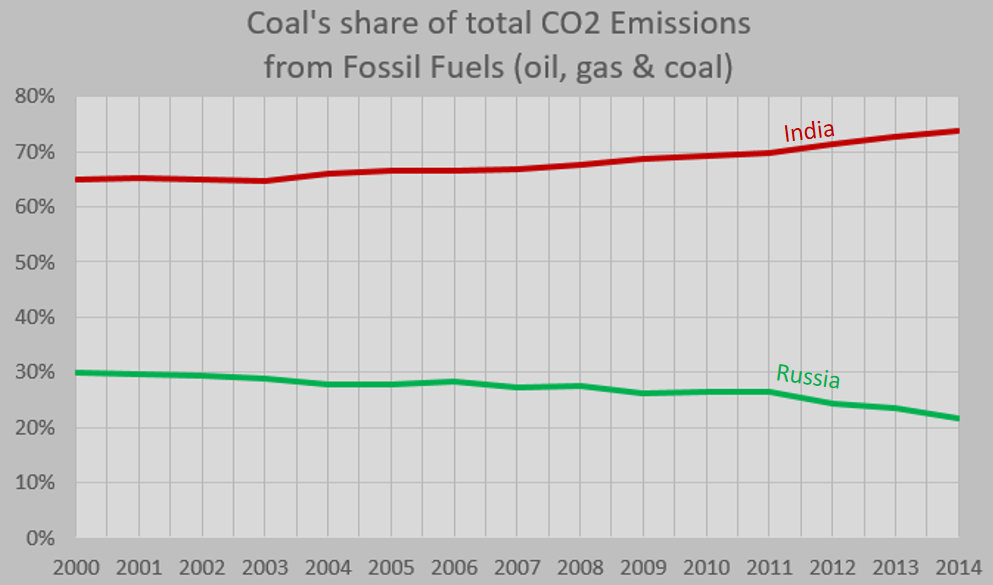
Coal is a more efficient climate destroyer than oil and natural gas. India is the world’s 4th largest coal producer (6.5% of the global production) and holds the 5th biggest coal reserves (7% of the global reserves), while Russia is the world’s 6th largest coal producer (4.6% of the global production) and holds the 2nd biggest coal reserves (18% of the global reserves).
The diagram below shows India’s and Russia’s CO2 Emissions from coal combustion as percentage of total CO2 Emissions from Fossil Fuels. India’s coal-share is growing, while Russia’s is descending.
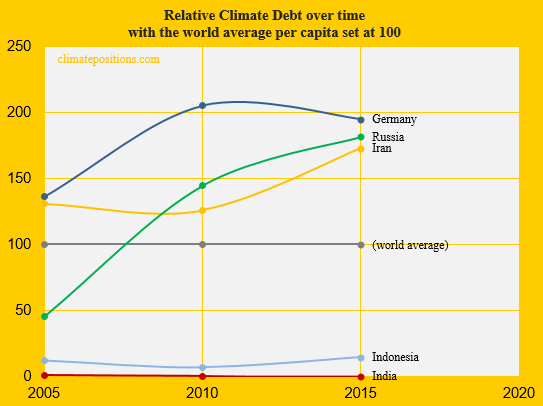
The diagram below shows the relative per capita Climate Debt of India and Russia, in comparison with the world’s 6th, 7th and 10th largest emitters: Germany, Iran and Indonesia; with the world’s average Climate Debt set at 100. India’s current per capita Climate Debt is $2, and Russia’s is $1,644 (see the latest ‘Ranking‘).
[Some figures in this article were corrected 22/5 2017]
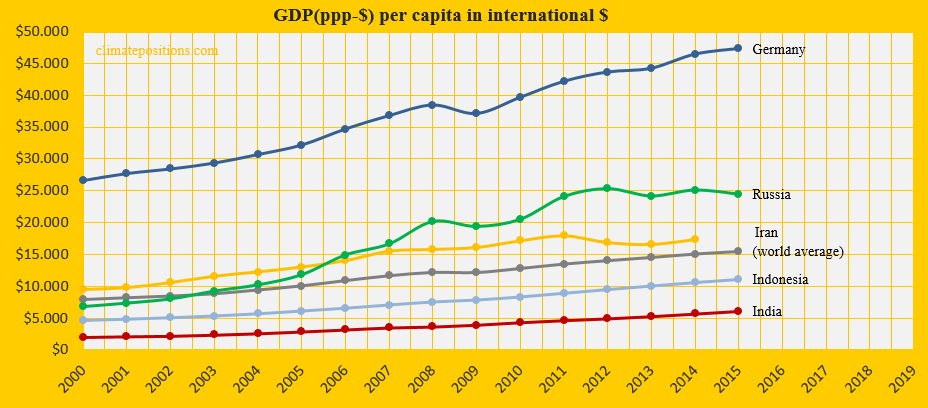
The diagram below shows the per capita GDP(ppp-$) of the same five countries and the world average. The wealth of India in 2015 was only 39% of world average. Russia’s wealth in 2015 was 3.4% below the 2012-level.
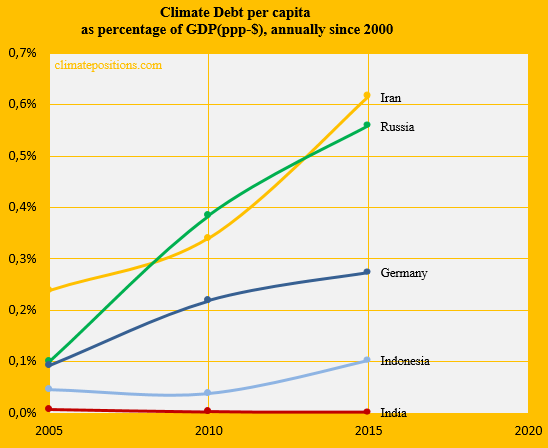
The next diagram (below) shows the Climate Debt of the five countries calculated as percentage of GDP(ppp-$), annually since 2000. See the updated ‘Ranking‘.
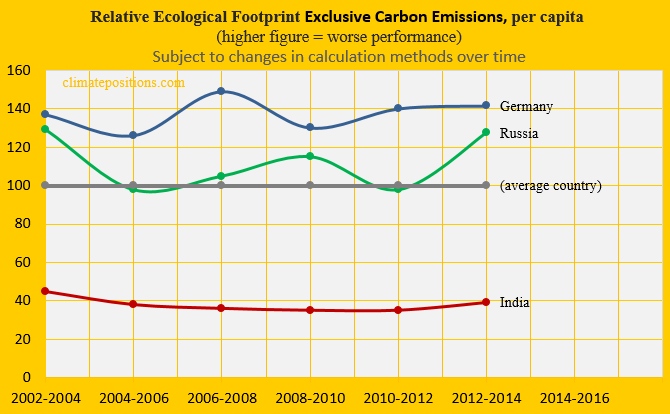
The next diagram shows the relative per capita Ecological Footprint without the carbon footprint, of India, Russia and Germany, with an average country set at 100. India’s footprint is far below world average.
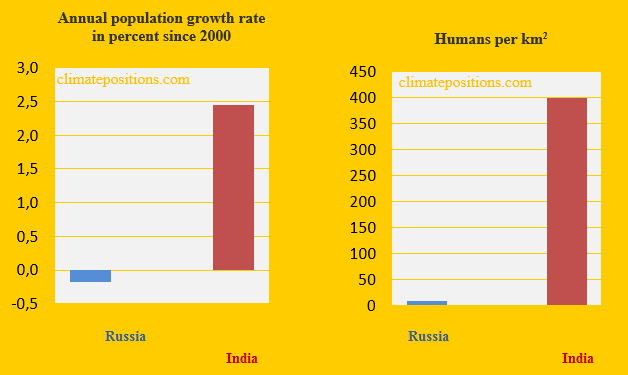
The last two diagrams show some Population trends. The Population growth rate of India, annually 2000-2015, was 2.44%, while the growth-rate of Russia was -0.17% (negative). However, an average km² in India is populated by 399 people, while an average km² in Russia is populated by only 8 people. For comparison the world’s growth-rate was 2.01% and an average km² is populated by 54 people.
.
Finally, the table below shows four key values of the five countries when calculating national Climate Debts.
| . | Tons of CO2 | Price per | Climate change | Financing as |
| . | exceeded since | ton CO2 | financing | share of |
| . | 2000, per capita | since 2000 | per capita | Climate Debt |
| . | . | . | . | . |
| India | 0.09 | $0.12 | $0.01 | 0.31% |
| Russia | 54.50 | $8.86 | $0.01 | 0.00% |
| Germany | 30.45 | $11.80 | $38.95 | 2.00% |
| Iran | 61.40 | $12.18 | $0.00 | 0.00% |
| Indonesia | 9.24 | $4.24 | $0.00 | 0.01% |
.
¹The Free Emission Level (green bars) is determined by national CO2 Emissions 1990-1999 (base), and 11 more ‘Indicators‘, of which 7 are national and 4 are global.
.
Updated data and diagrams of all ‘Indicators‘ and all countries in ClimatePositions are available in the menu ‘Calculations (Excel)‘.
Data on carbon emissions (CO2 Emissions) from fossil fuels (without bunkers) and cement production are from Global Carbon Project (CDIAC); (links in the menu “Calculations”).
Information on national GDP(ppp-$) per capita: Worldbank (links in the menu “Calculations”).
Source on Ecological Footprint: Global Footprint Network (links in the menu “Calculations”).
Data on Populations is from Worldbank (links in the menu “Calculations”).
Source on climate change financing (funding) is from Climate Funds Update (links in the menu “Calculations”).
Drawing by Claus Andersen, 2016.
Comments are closed.