Climate change performance: Japan vs. Germany (Renewable Energy and Nuclear Power)
2016
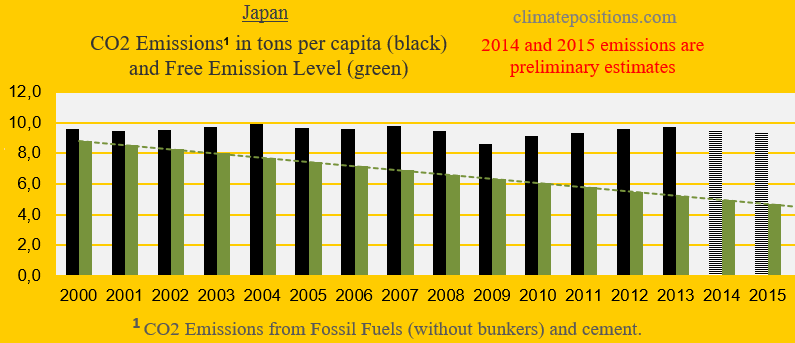
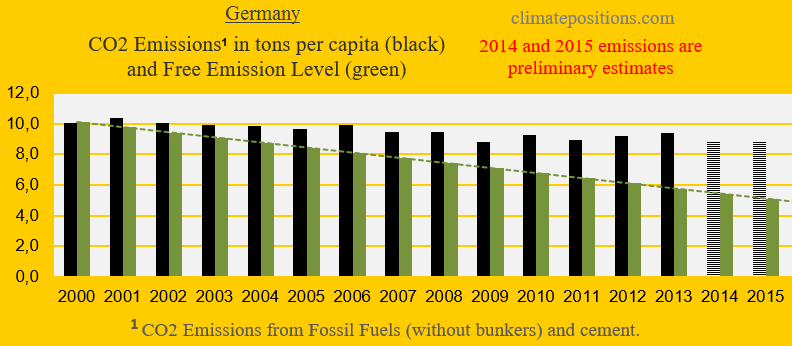
The world’s 5th and 6th largest emitters of CO2 from Fossil Fuel (without bunkers) and cement Japan and Germany, were responsible for 3.4% and 2.1% of the global emissions in 2015. The diagrams below show the per capita CO2 Emissions, annually since 2000. The green bars show the Free Emission Level¹ – the exceedance is the basis for calculating the national Climate Debt.
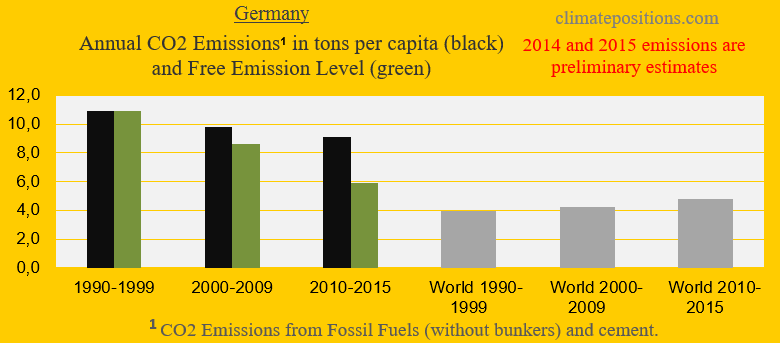
The next two diagrams show Japan’s and Germany’s CO2 Emissions in tons per capita, in decades. The grey bars are world emissions average.

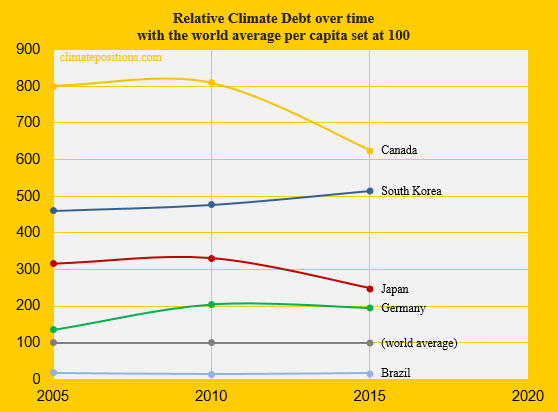
The diagram below shows the relative per capita Climate Debt of Japan and Germany, in comparison with the world’s 9th, 11th and 13th largest emitters South Korea, Brazil and Canada – with the world’s average Climate Debt set at 100. The German per capita Climate Debt is twofold the world average.
Japan’s per capita Climate Debt is $$2,151 (ranks 22) and Germany’s is $1,761 (ranks 25). See the latest ‘Ranking‘.
[Some figures in this article were corrected 22/5 2017]
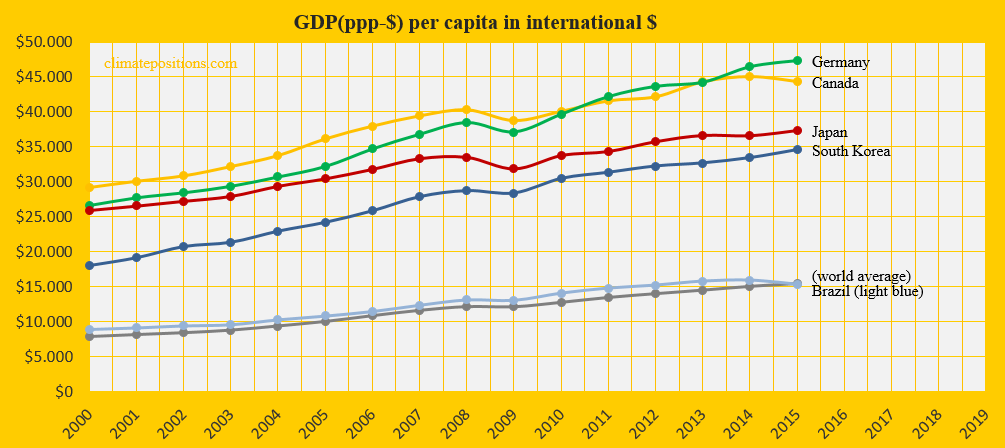
The diagram below shows the per capita GDP(ppp-$) of the same five countries and the world average. The wealth of Germany is more than threefold the world average.
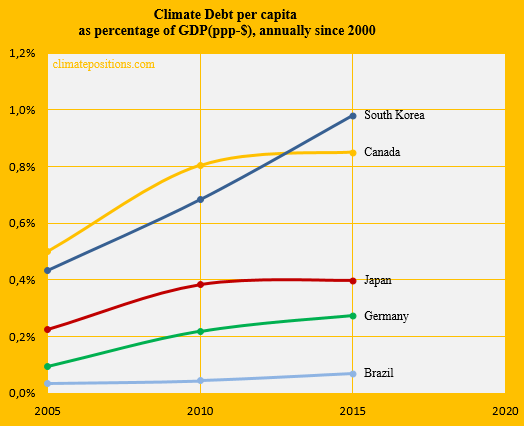
The next diagram (below) shows the Climate Debt of the five countries calculated as percentage of GDP(ppp-$), annually since 2000. See the updated ‘Ranking‘.
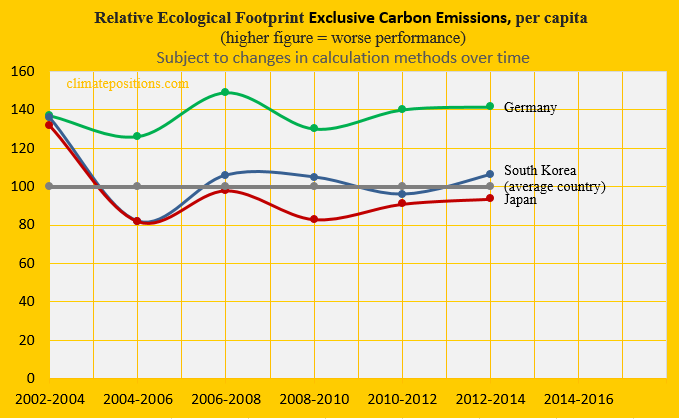
The next diagram shows the relative per capita Ecological Footprint without the carbon footprint of Japan, Germany and South Korea, with an average country set at 100. Japan’s footprint is below world average and considerably smaller than Germany’s.
The total Primary Energy consumption (Btu) of Japan and Germany decreased by 8.8% and 2.9%, respectively, between 2011 and 2014. The tables below show the trends in generation (Btu) of Renewable Energy and Nuclear Power, as shares of the Primary Energy consumption, during the four-year period.
Japan’s renewable-share of the total Primary Energy consumption increased by 1.6%, while Germany’s increased by 3.0%.
| Japan | 2011 | 2014 |
| . | . | . |
| Primary Energy consumption | 20.9 | 19.1 |
| (Quadrillion Btu) | . | . |
| Hydroelectricity | 3.8% | 4.0% |
| Solar | 0.2% | 1.2% |
| Wind | 0.2% | 0.3% |
| Biomass and Waste | 1.4% | 1.8% |
| Total (all four renewable) | 5.7% | 7.3% |
| Nuclear Power | 7.6% | 0.0% |
| Germany | 2011 | 2014 |
| . | . | . |
| Primary Energy consumption | 13.5 | 13.1 |
| (Quadrillion Btu) | . | . |
| Hydroelectricity | 1.3% | 1.4% |
| Solar | 1.4% | 2.6% |
| Wind | 3.5% | 4.2% |
| Biomass and Waste | 3.2% | 4.1% |
| Total (all four renewable) | 9.4% | 12.3% |
| Nuclear Power | 7.5% | 6.9% |
The per capita Nuclear Power generation 2000-2015 is shown below. In 2006, Japan and Germany were the world’s 3rd and 4th biggest Nuclear generators (in 2015 the rankings were 27th and 7th, respectively). In the calculation of Climate Debt, Nuclear Power must be phased out similar to Fossil Fuels (calculated as if Nuclear Power was generated by oil).
![]()
Finally, the table below shows four key values of the five countries, in the calculation of national Climate Debts in ClimatePositions.
| . | Tons of CO2 | Price per | Climate change | Financing as |
| . | exceeded since | ton CO2 | financing | share of |
| . | 2000, per capita | since 2000 | per capita | Climate Debt |
| . | . | . | . | . |
| Japan | 44.06 | $14.30 | $15.73 | 1.14% |
| Germany | 30.45 | $11.80 | $38.95 | 2.00% |
| South Korea | 98.49 | $25.23 | $0.26 | 0.05% |
| Brazil | 7.17 | $4.57 | $0.03 | 0.02% |
| Canada | 86.25 | $20.35 | $20.45 | 0.48% |
.
¹The Free Emission Level (green bars) is determined by national CO2 Emissions 1990-1999 (base), and 11 more ‘Indicators‘, of which 7 are national and 4 are global.
.
Updated data and diagrams of all ‘Indicators’ and all countries in ClimatePositions are available in the menu ‘Calculations (Excel)’.
Data on carbon emissions (CO2 Emissions) from fossil fuels (without bunkers) and cement production are from Global Carbon Project (CDIAC); (links in the menu “Calculations”).
Information on national GDP(ppp-$) per capita: Worldbank (links in the menu “Calculations”).
Source on Ecological Footprint: Global Footprint Network (links in the menu “Calculations”).
Source on Renewable Energy and total energy consumption: ‘http://www.eia.gov/beta/international/data/browser/#/?vs=INTL.44-1-AFRC-QBTU.A&vo=0&v=H&start=1980&end=2014‘
Data on national Nuclear Power generation: World Nuclear Association (links in the menu “Calculations”).
Source on climate change financing (funding) is from Climate Funds Update (links in the menu “Calculations”).
Drawing by Claus Andersen, 2016.
Comments are closed.