Climate change performance: Malaysia vs. Spain

2017
Malaysia and Spain are the world’s 23rd and 24th largest emitters of CO2 from Fossil Fuels and cement. Combined, the two countries were responsible for 1.4% of world CO2 Emissions in 2015. The following examines the ‘Indicators‘ of CO2 Emissions, GDP(ppp-$), Forest Cover (and Primary Forest) and Environmental Performance.
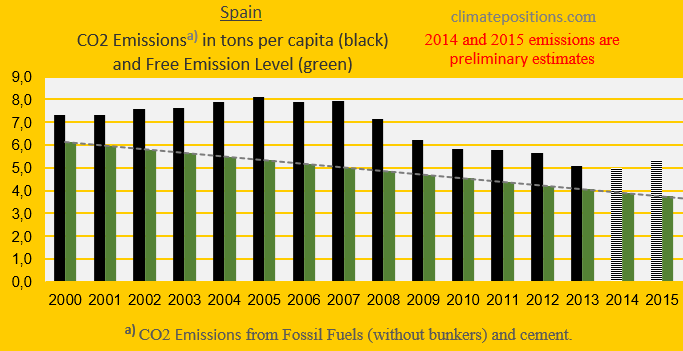
The diagrams below show the per capita CO2 Emissions from Fossil Fuel (without bunkers) and cement, since 2000. The green bars show the Free Emission Level¹ – the exceedance is the basis for calculating the national Climate Debt. The Spanish reductions are pretty much balanced by the Malaysian increases … which is world symptomatic. 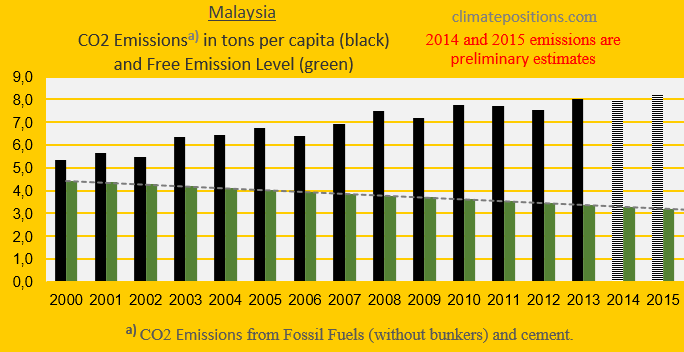
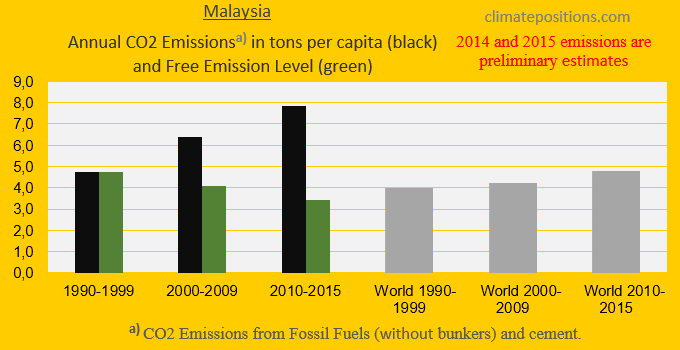
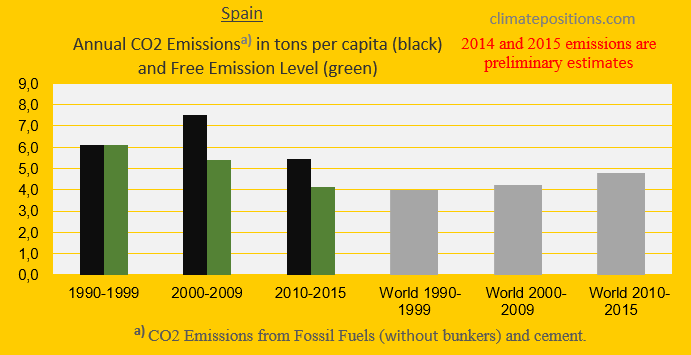
The next two diagrams show CO2 Emissions in tons per capita, in decades. Malaysia must reduce emissions by 39% by 2020, compared to 1990s, while Spain must reduce by nearly 49%. The grey bars are world emissions average.
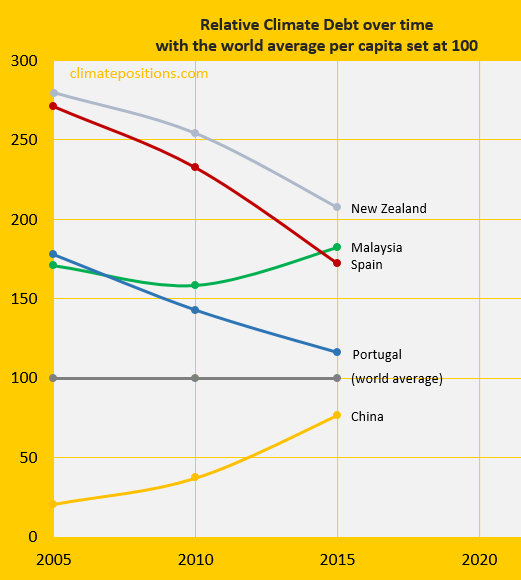
The diagram below shows the relative per capita Climate Debt of Brazil and Mexico, in comparison with China, Portugal and New Zealand – with the world’s average Climate Debt set at 100. The current Malaysian per capita Climate Debt is $1,554 and Spain’s is $1,305 (see the latest ‘Ranking‘).
[Some figures in this article were corrected 22/5 2017]
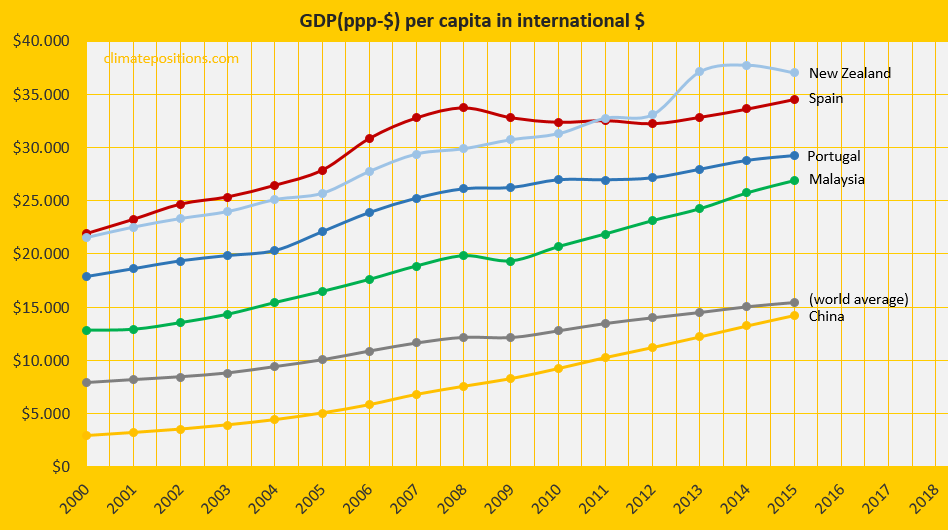
The diagram below shows the per capita GDP(ppp-$) of the same five countries and the world average. The wealth of Spain was 28% higher than Malaysia’s, in 2015.
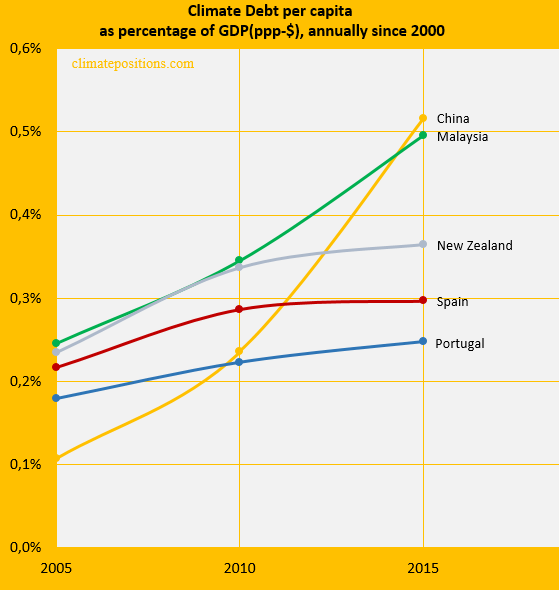
The next diagram shows Climate Debt of the five countries calculated as percentage of GDP(ppp-$), annually since 2000. See the updated ‘Ranking‘.
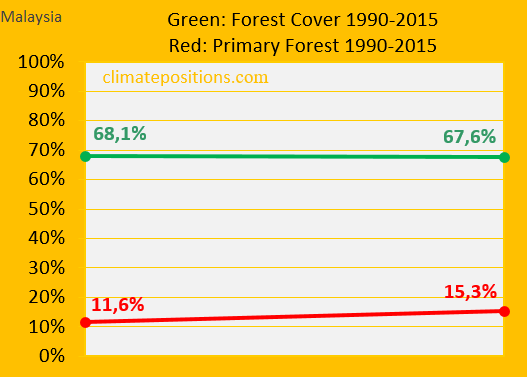
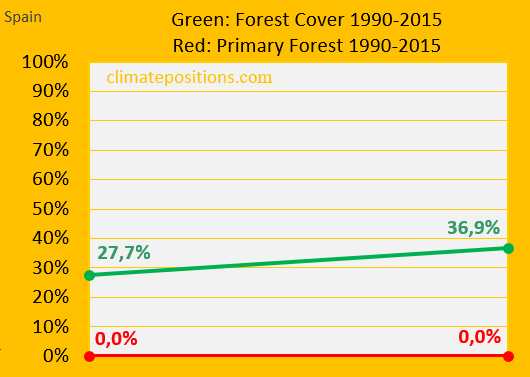
The two diagrams below show the changes in Forest Cover and Primary Forests, from 1990 to 2015, of the two countries. Between 1990 and 2015, the Malaysian Forest Cover decreased slightly, while the precious Primary Forests grew by impressive 32%. The Spanish Forest Cover increased by remarkably one third, however, still with zero Primary Forests.
The relative Environmental Performance over time of Malaysia, Spain and China, with the world’s average set at 100, is shown below. The ‘Environmental Performance Index’ published January 2016 (note that the data-year is set at 2014 in the diagram below) ranks Malaysia 63rd among 180 countries (see ‘Details‘), while Spain ranks 6th (see ‘Details‘).
Finally, the table below shows four key values of the five countries, in the calculation of national Climate Debts in ClimatePositions. The price of CO2 per ton (column two) is for the total CO2 Emission from Fossil Fuels (without bunkers) and cement. Climate change financing (column three) is from June 2016.
| . | Tons of CO2 | Price per | Climate change | Financing as |
| . | exceeded since | ton CO2 | financing | share of |
| . | 2000 per capita | since 2000 | per capita | Climate Debt |
| . | . | . | . | . |
| Malaysia | 50.03 | $13.97 | $0.00 | 0.00% |
| Spain | 28.68 | $12.22 | $10.43 | 0.80% |
| China | 47.35 | $7.86 | $0.01 | 0.00% |
| Portugal | 23.96 | $10.59 | $0.58 | 0.06% |
| New Zealand | 37.41 | $13.63 | $3.05 | 0.18% |
.
¹The Free Emission Level (green bars) is determined by national CO2 Emissions 1990-1999 (baseline), and 11 more ‘Indicators‘, of which 7 are national and 4 are global.
.
Updated data and diagrams of all ‘Indicators‘ and all countries in ClimatePositions are available in the menu ‘Calculations (Excel)‘.
Data on carbon emissions (CO2 Emissions) from fossil fuels (without bunkers) and cement production are from Global Carbon Project (CDIAC); (links in the menu Calculations / Sources & Links).
Information on national GDP(ppp-$) per capita: Worldbank (Calculations / Sources & Links).
Sources on national Forest Cover and Primary Forests: United Nations (UN) (Report: Global Forest Resources Assessments) (Calculations / Sources & Links).
Source on Environmental Performance: Yale and Columbia University reports, published 2006-2016 (Calculations / Sources & Links).
Drawing (writing) by Claus Andersen, 2017.
Comments are closed.