Climate change performance of Malaysia, Thailand, Indonesia and the Philippines
2015
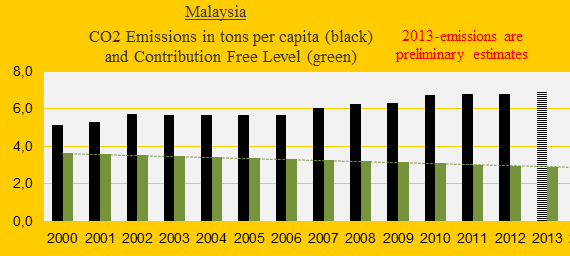
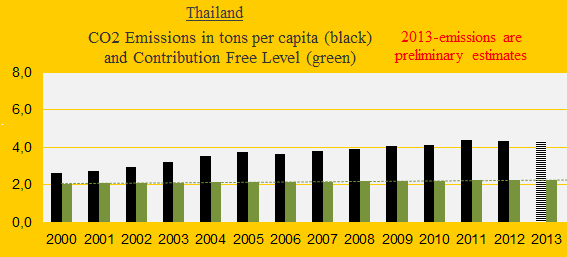
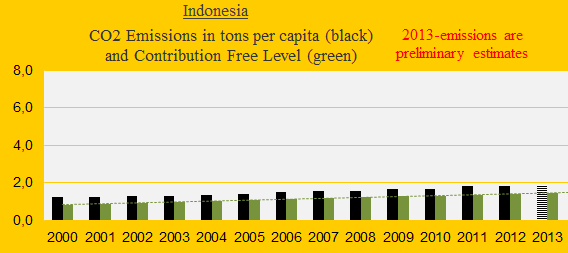
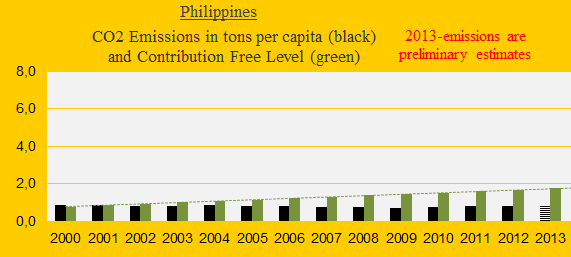
6.4% of the world population lives in Malaysia, Thailand, Indonesia or the Philippines – they emitted 3.2% of the global carbon dioxide from fossil fuels in 2012. The four diagrams below show the emissions per capita 2000-2013 (preliminary estimates of 2013) of the four populous countries of which only the Philippines is Contribution Free (no climate debt) in ClimatePositions. The green bars are the Contribution Free Level of CO2 Emissions calculated from emissions in 1990s and a number of continuously updated ‘indicators’.
The updated Climate Contributions (climate debt) per capita of the four countries are shown in the table below. The second column shows the percentage of climate debt due to changes in Forest Cover (including the precious Primary Forests)¹. The third column shows the world ranking of climate debt per capita (see the ‘ranking’).
———————————————————————————————-
| . | Climate debt | Debt caused by | Climate debt |
| . | per capita | deforestation | per capita |
| . | jan-15 | (percent) | World rank |
| . | . | . | . |
| Malaysia | $1,227 | 10% | 32 |
| Thailand | $409 | 2% | 53 |
| Indonesia | $65 | 60% | 73 |
| Philippines | Free | Free | Free |
———————————————————————————————-
The diagram below shows the development of relative Climate Contributions (debt) since 2005 with the world average set at 100. China is included for comparison and poor precedent. (percent).

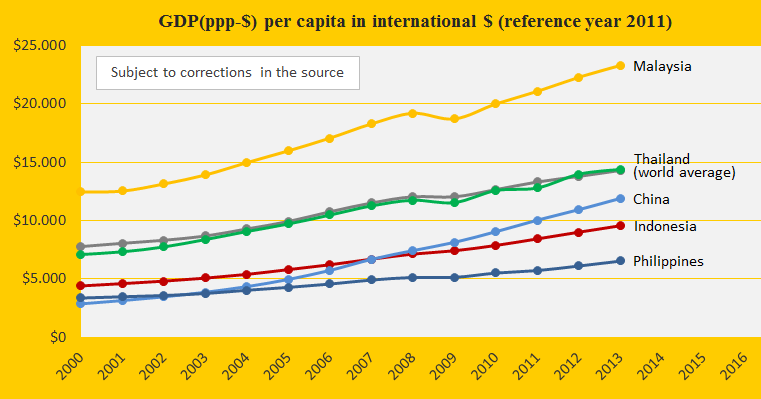
The diagram below shows the GDP(ppp-$) per capita since 2000 of the four countries, China and the world average. The Malaysian growth rate is similar to the one of China – both with dramatic increases of CO2 Emissions as well.
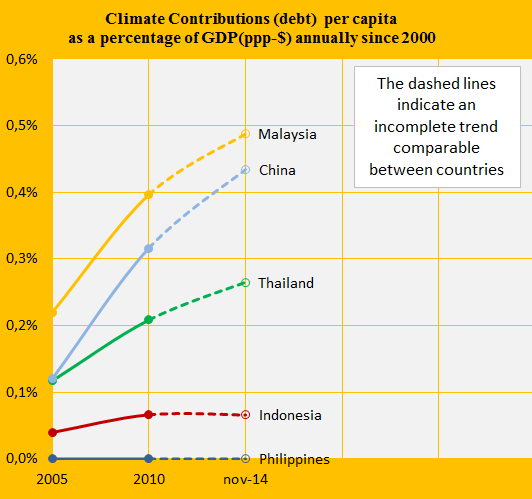
The accumulated climate debt per capita calculated as a percentage of GDP(ppp-$) annually since 2000 – see below – reveal the same trend: Malaysia, along with China, rumble away with fossil fuel economy regardless of the global consequences for the climate. Indonesia seems to have stabilized since 2010. See the global ‘ranking’.
.
¹The Forest Cover in 1990 and 2010 were: Malaysia (68.1% and 62.3%), Thailand (38.3% and 37.1%), Indonesia (65.4% and 52.1%) and the Philippines (22.0% and 25.7%). Primary Forests covered (of the total land area) in 2000 and 2010: Malaysia (4.0% and 2.8%), Thailand (13.1% and 13.1%), Indonesia (25.9% and 24.8%) and the Philippines (2.9% and 2.9%).
If Malaysia had remained at the lower CO2 Emission level since the 1990s (4.3 tons per capita in average), then the climate debt today would have been $13 billion instead of $36 billion.
.
Information on national GDP(ppp-$) per capita: Worldbank (links in the menu “Calculations”).
Source on CO2 Emissions: EIA, U.S. Energy Information Administration and data on preliminary national CO2 Emissions are from Global Carbon Project (links in the menu “Calculations”).
Sources on national forest cover and primary forests: United Nations (UN) (links in the menu “Calculations”).
Drawing by Claus Andersen, 2015.
Comments are closed.