Climate change performance of Norway (and the giant oil fund)

2015
Norway’s first oil field started production in 1971 and since 1996 petroleum revenue has been transferred to what’s now called the ‘Government Pension Fund Global’ – often referred to as Norway’s Oil Fund. Today, the fund’s market value is around $884 Billion. For comparison, the updated Norwegian Climate Contribution in ClimatePositions is $16.4 Billion and the climate financing¹ $1.5 Billion. Below are listed some perspectival per capita figures:
- The current market value of Norway’s Oil Fund is around $188,000 per capita (per Norwegian). In 2000 the market value was $11,000 per capita.
- The accumulated Climate Contribution in ClimatePositions is $3,490 per capita.
- The climate financing is $321 per capita (9% of the Climate Contribution which is world record; read this ‘article‘).
- The updated Climate Debt is $3,169 per capita which ranks Norway 15th in the world (see the ‘ranking’).
- The oil production per capita was 6th in the world in 2013, after Qatar, Kuwait, United Arab Emirates, Saudi Arabia and Equatorial Guinea – in 2000 Norway was 2nd. Norway’s oil production decreased by 46% between 2000 and 2013 … the world production increased by 17% during the same period.
- The natural gas production per capita was 4th in the world in 2012, after Qatar, Trinidad and Tobago and Brunei. Norway’s natural gas production increased by 106% between 2000 and 2012 … the world production increased by 37% during the same period.
The following examines Norway’s CO2 Emissions, Climate Debt over time, GDP(ppp-$) and the investment strategy of Norway’s Oil Fund.
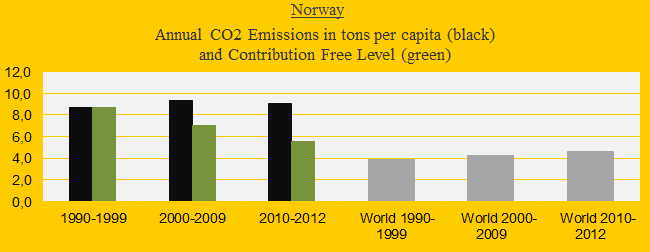
The first diagram (below) shows Norway’s CO2 Emissions from fossil fuels per capita in decades. The green bars are the Contribution Free Level and the grey bars are the world average. The average emissions since 2000 were 7% above the level in the 1990s.
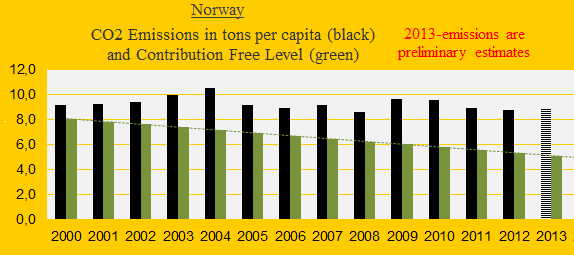
The CO2 Emissions per capita since 2000 are sequences of ups and downs, with no consistent reduction trend (see the diagram below). The total exceedance since 2000 is 38 tons of CO2 per capita – the exceeded emissions are the basis of the calculation of the national Climate Debt. Note that 2013-emissions are preliminary estimates.
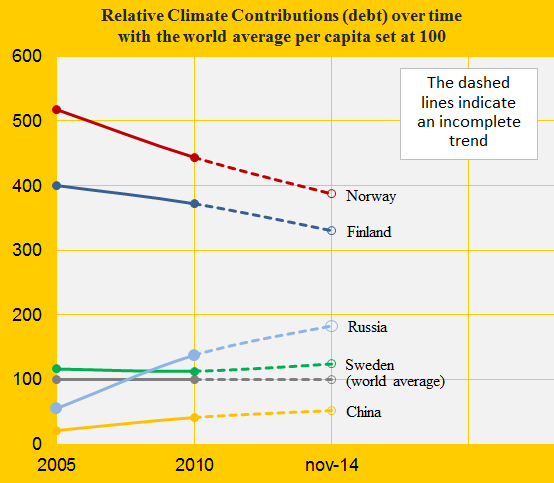
The diagram below shows the relative Climate Debt per capita since 2005 of Norway, Finland, Russia, Sweden, and China, with the world average set at 100. Norway has the largest Climate Debt among the five countries but the gap between them narrows.
The GDP(ppp-$) per capita since 2000 of the same five countries, and the world average, is shown in the diagram below. Only a few small oil states or tax havens are wealthier than Norway.

The Climate Debt calculated as percentages of the GDP(ppp-$) annually since 2000, of the five countries, are shown in the diagram below. Using this calculation method, China recently passed Norway which is now ranked number 33rd. See the ‘ranking’.

Norway’s Oil Fund, parliamentary adopted 1990, is the world’s most honest and transparent illustration of historic fossil fuel profitmaking regardless of climate change and lives of future generations on earth. As late as 2004, ethical guidelines were established for the fund (guidelines evaluated 2009) and in 2014 the celebrating news were announced (after having performed 917 company assessments accounting for 25 percent of the equity portfolio’s market value of which 415 companies were related to climate change), quote: “Based on these assessments, we chose to divest from 49 companies in 2014 where we considered there to be high levels of uncertainty about the sustainability of their business model.” And: “In total, we have divested from 114 companies in the past three years.” Bravo Norway.
According to an ‘article in The Guardian’ 32 coal mining companies were removed from the oil fund’s portfolio in 2014 (including 16 coal miners linked to deforestation in Indonesia and India and 2 coal companies in the United States involved in mountain-top removal) … the companies divested also include tar sands producers and cement makers due to their greenhouse gas emissions. Note that The Oil Fund does not reveal the names of the companies or the value of the divestments.
Undoubtedly, Norway’s Oil Fund is aware of the numerous studies² showing that companies which are at the forefront of implementing sustainability programs tend to provide superior long term returns.
A hypothetical example: If 1.7% of Norway’s Oil Fund’s market value of $884 Billion were spent on climate financing¹ (paying the national Climate Debt of $14.9 Billion accumulated since 2000) Norway would be Contribution Free in ClimatePositions. At the same time, the current global climate financing would be doubled.
¹As defined and compiled by ‘Climate Funds Update‘ which is an independent website that provides information on international climate finance initiatives designed to help developing countries address the challenges of climate change.
²Information from an article in The Guardian: ‘Public pension funds: sustainable investment pioneers‘ refering to a recent ‘study of the Harvard Business School‘ (pdf) where the share price performance of 180 companies was analysed over 18 years, between 1993 and 2011.
.
Information on national GDP(ppp-$) per capita: Worldbank (links in the menu “Calculations”).
Source on CO2 Emissions: EIA, U.S. Energy Information Administration and data on preliminary national CO2 Emissions are from Global Carbon Project (links in the menu “Calculations”).
Source on climate change funding is from Climate Funds Update (links in the menu “Calculations”).
Information on Norway’s Oil Fund: ‘Government Pension Fund Global’, ‘Coastal & MarinE-News‘, The Guardian ‘Public pension funds: sustainable investment pioneers‘, The Guardian ‘World’s biggest sovereign wealth fund dumps dozens of coal Companies‘ and ‘Wikipedia‘.
Drawing by Claus Andersen, 2015.
Comments are closed.