Climate change performance of Panama, Honduras, Costa Rica and Nicaragua
2015
0.32% of the global population lives in Panama, Honduras, Costa Rica or Nicaragua, and together they emitted 0.12% of the global CO2 from fossil fuels in 2012. Panama’s updated Climate Debt per capita is $325 and the Honduran is $18. Costa Rica and Nicaragua are both Contribution Free. See the ‘ranking’ by November 2014. The following examines the indicators of CO2 Emissions (carbon dioxide from fossil fuels), Forests and GDP(ppp-$).
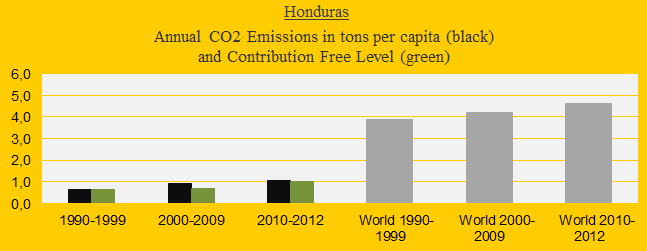
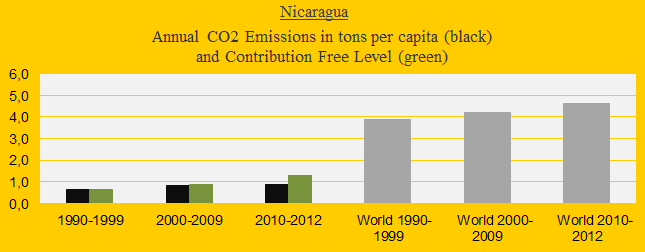
The four diagrams below show the CO2 Emissions per capita in decades of Panama, Honduras, Costa Rica and Nicaragua, in comparison with the world average (the grey bars). The green bars show the Contribution Free Level in ClimatePositions – the free level is calculated on the basis of the level of CO2 Emissions in 1990s and a number of continuously updated ‘indicators’. If the black bars exceed the green, on average, then the country has a Climate Debt.


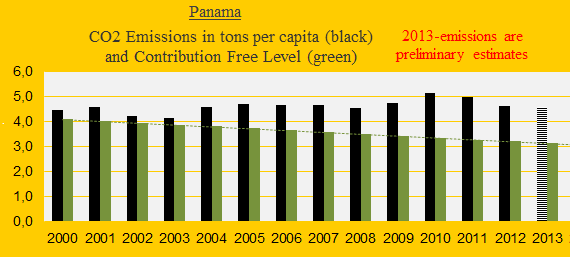
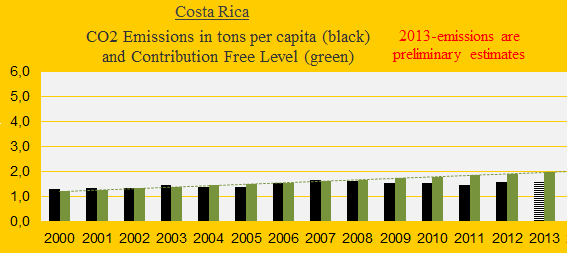
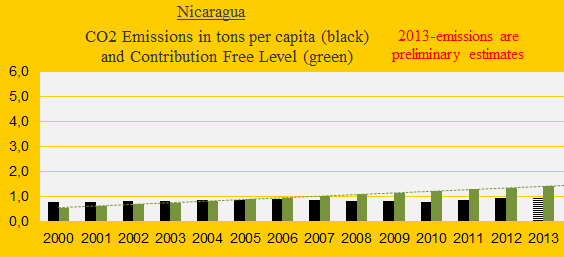
The next four diagrams show the CO2 Emissions per capita 2000-2013 (2013-emissions are preliminary estimates). Panama (with a large proportion of its emissions sourced from marine bunkers) must decrease emissions while the three latter may increase emissions moderately.

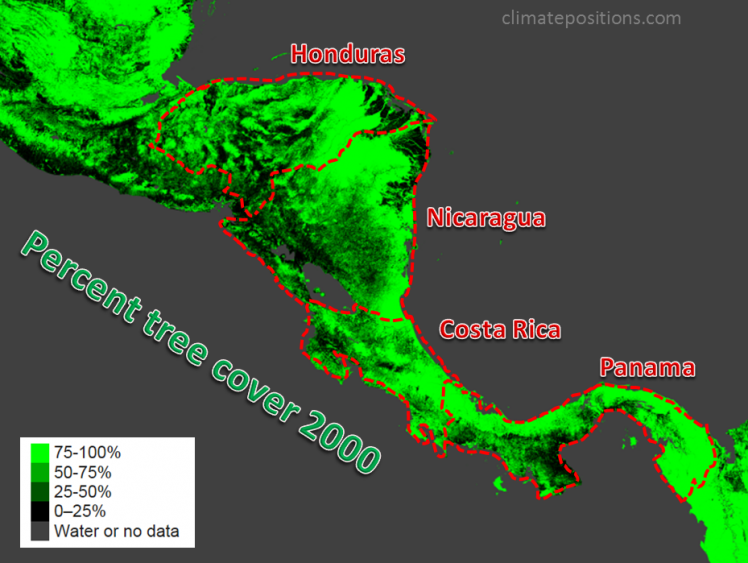
The table below shows the Forest Cover in 1990 and 2010 and Primary Forests in 2000 and 2010 (as percentages of the total land area). The overall trend is negative with Costa Rica as an expressive exception. The cover-change of the two forest categories combined is included in the calculations of Climate Debts. The combined changes are: Panama (-7.2%), Honduras (-26.3%), Costa Rica (0.8%) and Nicaragua (-12.6%). Read details on the forests at mongabay.com: ‘Panama‘, ‘Honduras‘, ‘Costa Rica‘ and ‘Nicaragua‘. See the hypothetical calculation examples at the bottom.
| . | Forest Cover | Forest Cover | Primary Forests | Primary Forests |
| . | 1990 | 2010 | 2000 | 2010 |
| . | . | . | . | . |
| Panama | 50.9% | 43.7% | 0.0% | 0.0% |
| Honduras | 72.7% | 46.4% | 4.1% | 4.1% |
| Costa Rica | 50.2% | 51.0% | 12.9% | 12.9% |
| Nicaragua | 37.2% | 25.7% | 10.9% | 9.8% |
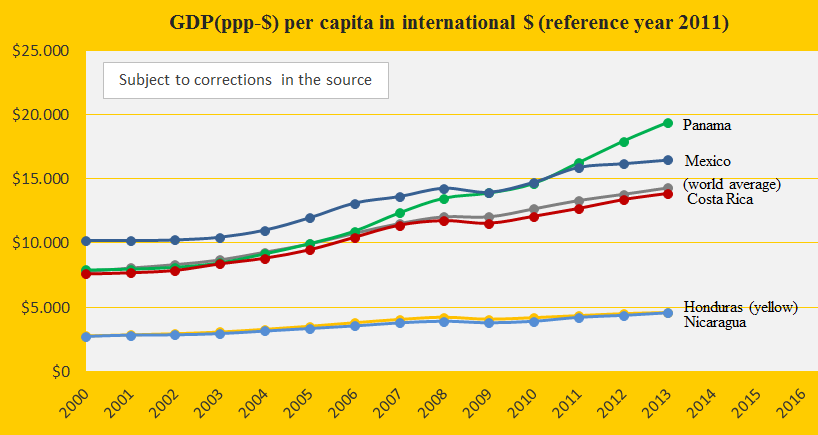
The GDP(ppp-$) per capita since 2000 of the same four countries, Mexico and the world average is shown in the diagram below. Honduras and Nicaragua are the poorest and Panama is the wealthiest.
Four hypothetical examples: 1) If Panama’s Primary Forests had increased to 24% in 2010, then the Climate Debt would have been $0 per capita instead of $325, 2) If the Honduran Forest Cover had been 62% in 2010 instead of 46.4%, then the country would have been Contribution Free, 3) If Costa Rica’s Forest Cover had been 44% in 2010 instead of 51%, then the Climate Debt would have been $3 per capita, and 4) If Nicaragua had deforested all forests in 2010, then the Climate Debt would have been $27 per capita.
.
Information on national GDP(ppp-$) per capita: Worldbank (links in the menu “Calculations”).
Source on CO2 Emissions: EIA, U.S. Energy Information Administration and data on preliminary national CO2 Emissions are from Global Carbon Project (links in the menu “Calculations”).
Sources on national forest cover and primary forests: United Nations (UN) (links in the menu “Calculations”).
Map at the top with tree cover in percent year 2000 (drawing etc. by Claus Andersen, 2015): ‘http://earthenginepartners.appspot.com/science-2013-global-forest‘.
Comments are closed.