Climate change performance of Slovenia, Croatia and Bosnia and Herzegovina
2015
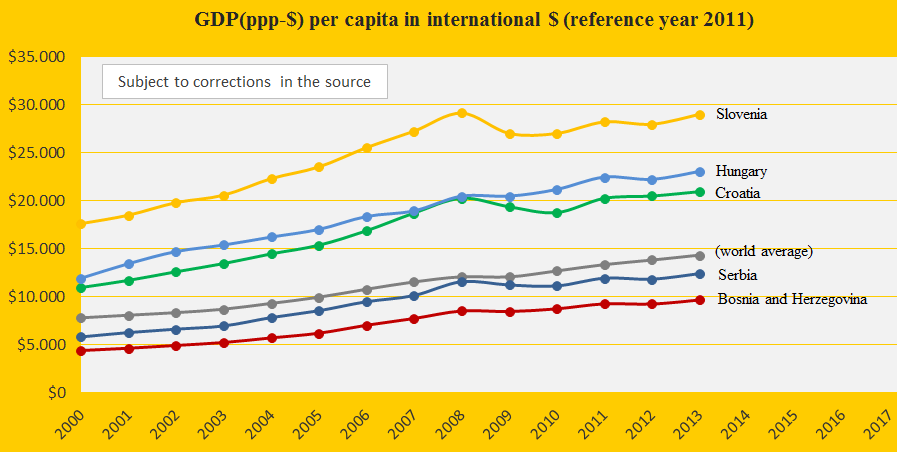
Slovenia, Croatia and Bosnia and Herzegovina are ranked 26th, 48th and 51st among 147 countries on the Climate Debt List in ClimatePositions (see the ‘ranking’). Their updated Climate Debts are respectively $1,660, $515 and $432 per capita. The following examines the GDP(ppp-$), CO2 Emissions from fossil fuels, Forest Cover, Nuclear Power and Relative Climate Debt over time. The first diagram shows the GDP(ppp-$) per capita of Slovenia, Croatia and Bosnia and Herzegovina, in comparison with Hungary, Serbia and the world average.
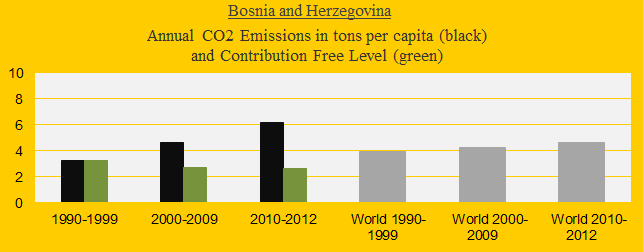
The three diagrams below show the CO2 Emissions per capita in decades of Slovenia, Croatia and Bosnia and Herzegovina, in comparison with the world average (the grey bars). The green bars show the Contribution Free Level in ClimatePositions – the Free Level is calculated on the basis of the level of CO2 Emissions in 1990s and a number of continuously updated ‘indicators’.
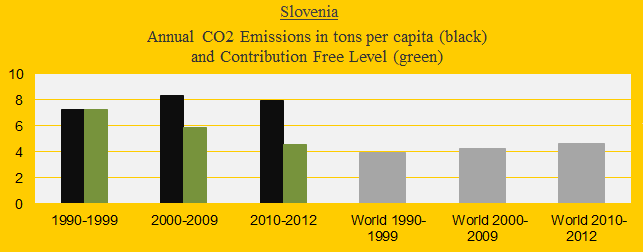
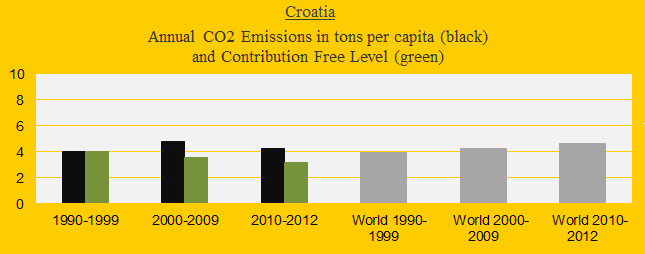
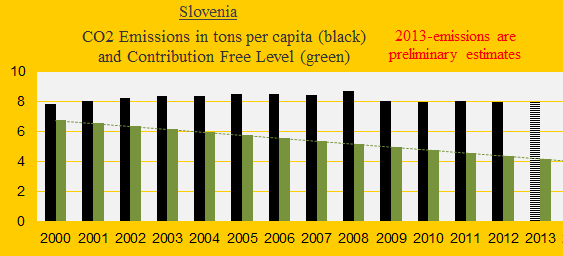
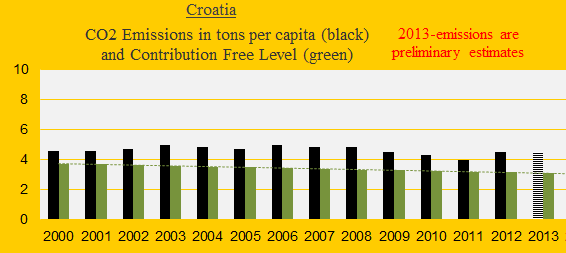
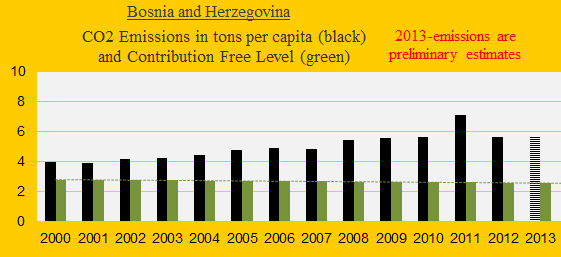
The three diagrams below show the CO2 Emissions (carbon dioxide from fossil fuels) in tons per capita since 2000. The green bars show the Contribution Free Level. The Slovenian CO2 Emissions have increased from 7.3 tons per capita in 1990s to 7.9 tons in 2012 (the CO2 Emission overshoot 2000-2013 is 30.0 tons per capita) – the corresponding emissions of Croatia were from 4.0 to 4.5 tons (overshoot: 11.8 tons) and of Bosnia and Herzegovina from 3.2 to 5.6 tons (overshoot: 29.4 tons).
The table below shows the Forest Cover in 1990 and 2010 and Primary Forests in 2000 and 2010 (as percentages of the total land area). Among the three, Slovenia is frontrunner.
| . | Forest Cover | Forest Cover | Primary Forests | Primary Forests |
| . | 1990 | 2010 | 2000 | 2010 |
| . | . | . | . | . |
| Slovenia | 59.0% | 62.2% | 4.7% | 5.4% |
| Croatia | 33.1% | 34.3% | 0.1% | 0.1% |
| Bosnia and Herz. | 43.2% | 42.7% | 0.0% | 0.0% |
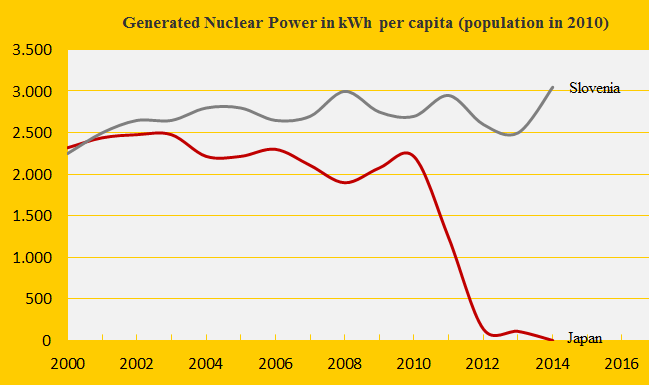
Slovenia is the world’s 7th largest per capita Nuclear Power generator, while Croatia and Bosnia and Herzegovina has no generation. The diagram below shows the Slovenian per capita generation since 2000 in comparison with Japan.
In ClimatePositions Nuclear Power generation must be reduced at the same rate as CO2 Emissions from fossil fuels, because large quantities of dangerous radioactive nuclear waste are left for hundreds of generations to deal with in the future.
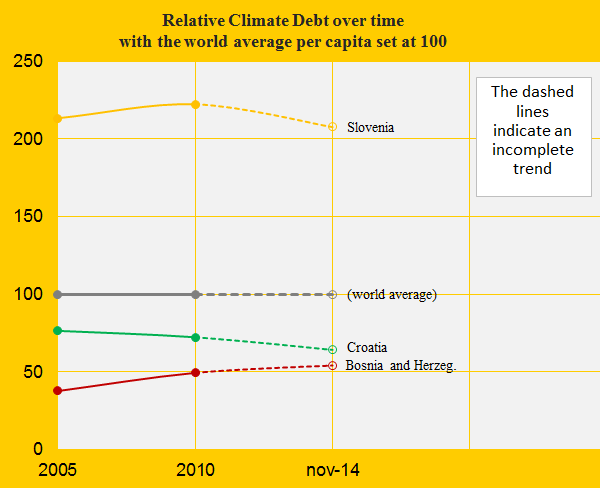
The next diagram (below) shows the relative Climate Debt since 2005 of Slovenia, Croatia and Bosnia and Herzegovina, with the world average set at 100. Economic growth without appropriate CO2 Emission reductions leads to an up-going curve. Note that the dashed lines are incomplete trends based on preliminary estimates.
.
Information on national GDP(ppp-$) per capita: Worldbank (links in the menu “Calculations”).
Source on CO2 Emissions: EIA, U.S. Energy Information Administration and data on preliminary national CO2 Emissions are from Global Carbon -Project (links in the menu “Calculations”).
Sources on national Forest Cover and Primary Forests: United Nations (UN) (links in the menu “Calculations”).
Data on national Nuclear Power generation: World Nuclear Association (links in the menu “Calculations”).
Drawing (strange map) by Claus Andersen, 2015.
Comments are closed.