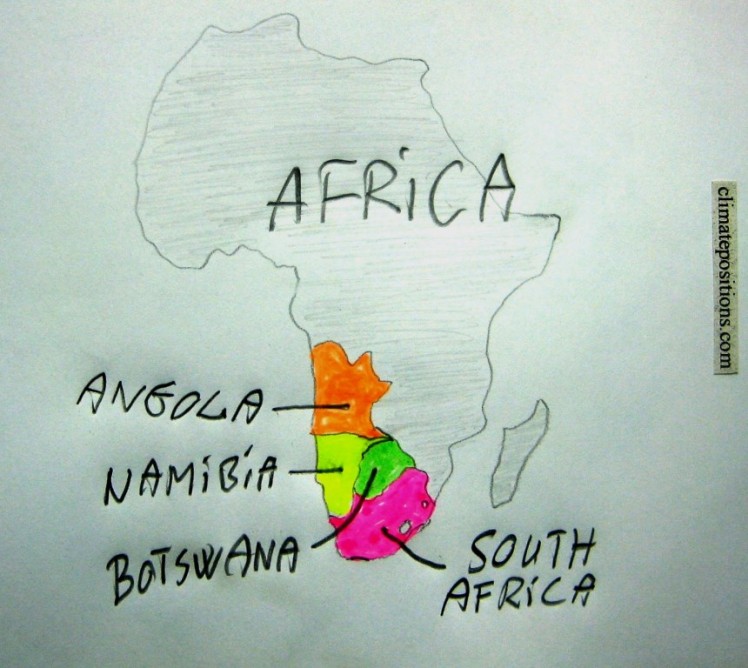
Climate change performance of South Africa, Botswana, Angola and Namibia
2015
36 out of 44 African countries in ClimatePositions are Contribution Free and the total climate debt of the African continent is 1.1% of the global climate debt – the share of the global population and CO2 Emissions from fossil fuels is respectively around 13.8% and 3.7%. The eight countries ranked below stand out in Africa by having a climate debt. This article analyses the performance of South Africa, Botswana, Angola and Namibia.
—————————————————————————
| Climate debt | ||
| per capita | ||
| . | . | . |
| 27. | Libya | $1,475 |
| 39. | South Africa | $864 |
| 46. | Mauritius | $499 |
| 67. | Algeria | $86 |
| 70. | Botswana | $69 |
| 75. | Angola | $33 |
| 76. | Namibia | $23 |
| 77. | Tunisia | $22 |
—————————————————————————
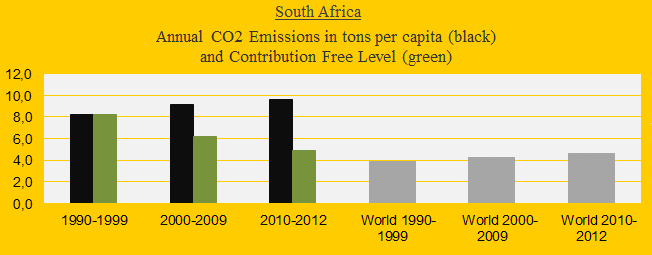
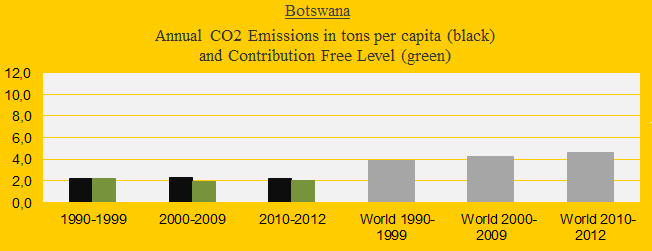
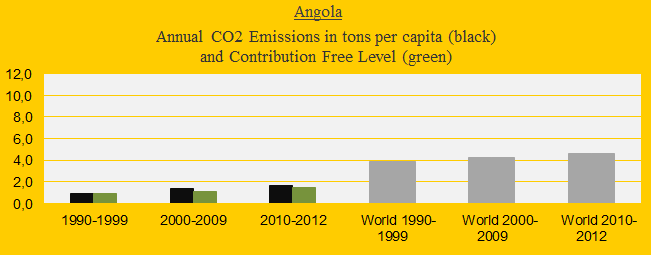
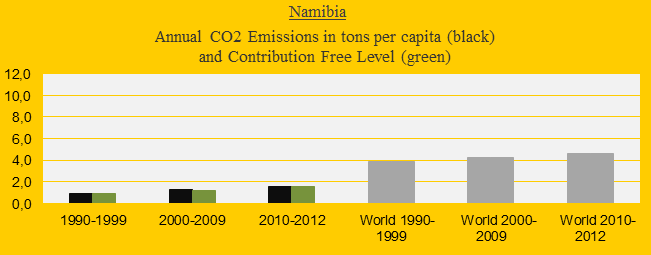
The four diagrams below show the CO2 Emissions per capita in decades (the green bars are the Contribution Free level) in comparison with the world average (the grey bars). South Africa’s emissions have increased from a high level since the 1990s. Note that 2013 emissions are not included in the diagrams (global estimates are available ‘here’). The main reason for South Africa’s high CO2 Emissions is the consumption of coal which supplies 72% of the energy (in 2012) – the consumption of coal has increased by 19% since 2000. In 2012 South Africa’s CO2 Emissions from fossil fuels accounted for 39% of Africa’s total emissions.
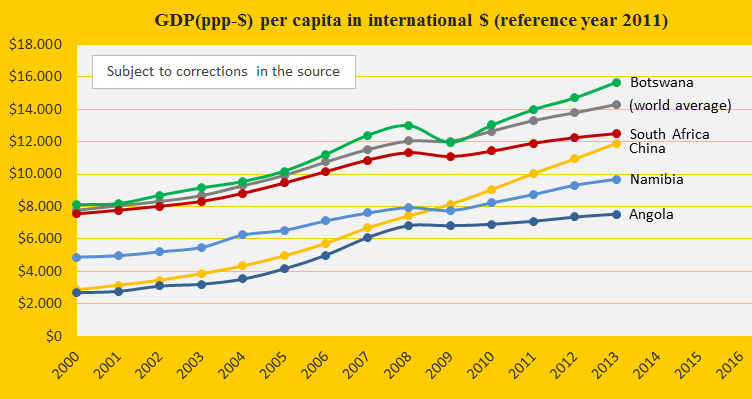
The diagram below shows the development of GDP(ppp-$) per capita since 2000 of the four countries, China and the world average. Botswana’s growth rate is similar to the one of China – only without the dramatic Chinese increase of CO2 Emissions.
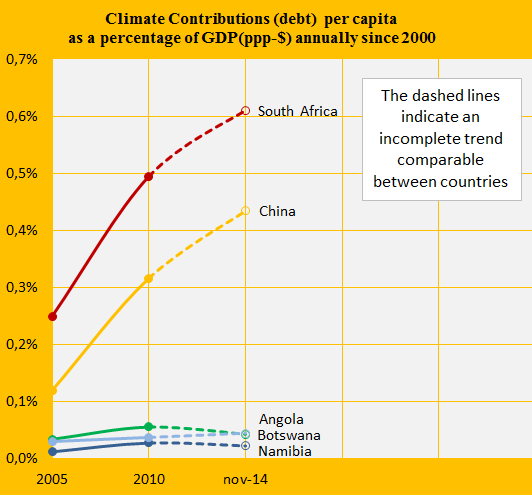
The accumulated climate debt per capita calculated as a percentage of GDP(ppp-$) annually since 2000 reveal the trend of the green economy. Only 6 countries out of 82 has improved (decreased the percentage) since 2010 – including Botswana and Namibia; while South Africa is in the same irresponsible league as China (the diagram below). See the global ‘ranking’.
A hypothetical example: If South Africa had not increased CO2 Emissions since the 1990s, then the total accumulated climate debt would have been $29 billion instead of $42 billion.
Source on CO2 Emissions and concumption of coal: EIA, U.S. Energy Information Administration (links in the menu “Calculations”).
Information on national GDP(ppp-$) per capita: Worldbank (links in the menu “Calculations”). Read about GDP+ in the submenu ”Indicators”.
Comments are closed.